We earlier noted the ‘Late afternoon and Evening run of volatility in NSW and QLD, on Thursday 7th November 2024’ … and, in that, noted the presence of constraints limiting the ability of the southern regions to help, via the VIC1-NSW1 interconnector.
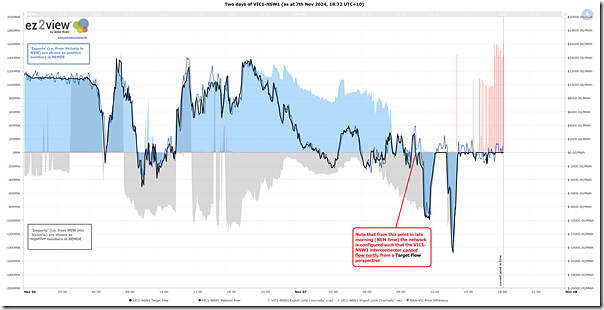
Utilising the ‘Trends Engine’ within ez2view we’ve put together the following trend highlighting Target Flow, Import Limit and Export limit on the interconnector:
For clients who have their own licence to the software, they can open your own copy of this Trend Query here.
For the broader readership, a couple key points:
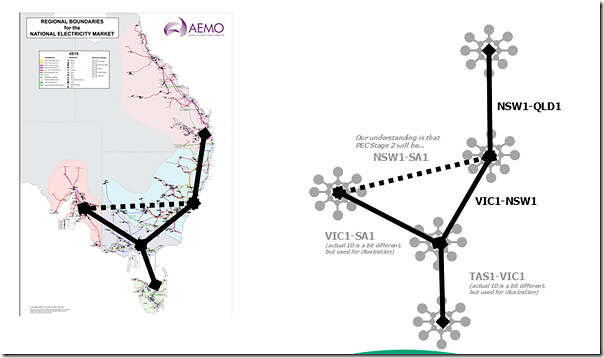
1) Better to think of an interconnector as a collection of all of the network elements making up the flow path between the relevant Regional Reference Nodes than just the bits of kit hanging over both sides of the region boundary – as per this sketch:
2) NEMDE is a mathematical model that produces dispatch (including price) outcomes …
(a) interconnectors need a number sign (i.e. flow in one direction is positive, the other direction is negative)
(b) easiest way I find to remember is that it’s Hobart-centric
(c) so for the VIC1-NSW1 interconnector, we have:
i. Flow (and Limits) VIC to NSW are positive
ii. Flow (and Limits) NSW to VIC are negative
3) We can see in the chart above:
(a) that the Export Limit and Export Limit vary markedly through all dispatch intervals in a day:
i. That’s because of the effect of constraints
ii. We recently also showed a different case for the ‘Heywood’ interconnector on 23rd September 2024.
(b) that flow will normally be from cheap region to expensive region … but that’s not always the case.
4) In the case of the VIC1-NSW1 interconnector, we see that from before 12:00 (NEM time) today, any flow north was not possible.
… in a subsequent article we’ll help explain why…


Can you explain why the Vic market occasionally has negative price spikes? For example at 2:10pm today the price was -$396/MWh.