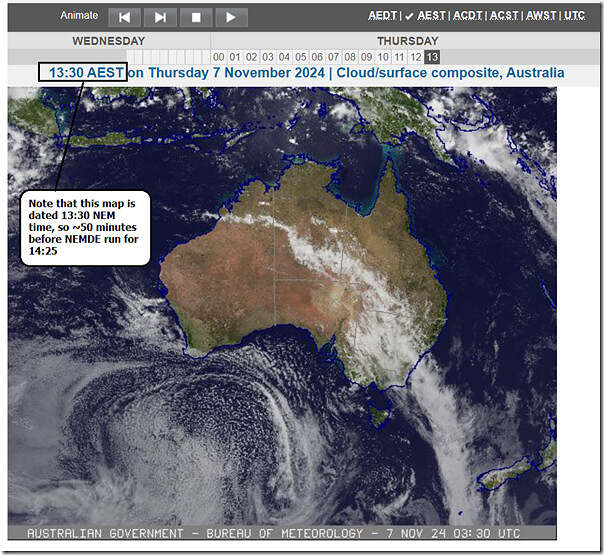
Here’s a snapshot from the BOM cloud map with a timestamp of 13:30 (NEM time) … so that snapshot’s taken ~50 minutes prior to the NEMDE run producing the price for the 14:25 dispatch interval (NEM time).
The cloud pattern will probably have moved somewhat over that period, but seems to suggest some sort of impact of cloud on rooftop PV:
1) Contributing to ‘Market Demand’ forecast difficulties; and
Paul was one of the founders of Global-Roam in February 2000. He is currently the CEO of the company and the principal author of WattClarity. Writing for WattClarity has become a natural extension of his work in understanding the electricity market, enabling him to lead the team in developing better software for clients.
Before co-founding the company, Paul worked as a Mechanical Engineer for the Queensland Electricity Commission in the early 1990s. He also gained international experience in Japan, the United States, Canada, the UK, and Argentina as part of his ES Cornwall Memorial Scholarship.
Three price spikes in the QLD region on Saturday 10th April 2021 help to remind us that how increasingly dependent we are on various machinations of the weather (including, on these occasions, cloud cover and solar output).
To further understand the frequency drop we delve into the 4-second data (used for regulation FCAS contribution calculations) in this Part 2, looking at generating units (including BDUs).
We follow on from A 292MW drop in “Market Demand” in Tasmania, on Saturday 16th August 2025 enlisting this “Part 2” to understand the sequence of events using 4-second data.
The by-now-familiar constraints on transmission from southern NSW towards the load centres north seem to be playing their part in this volatility as well.
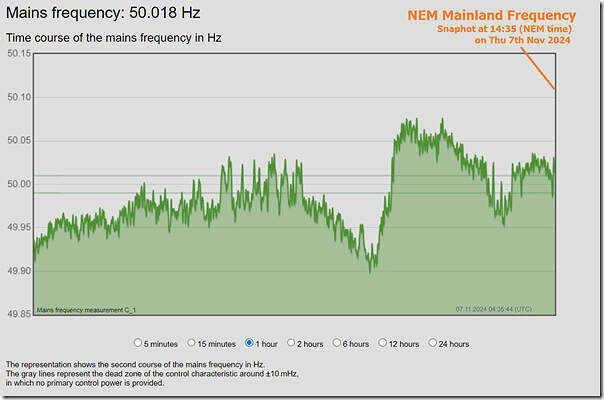
Hi Paul, I am a retired AEMO System Operations Control Room Operator. The statement that it was a “Small Frequency Wobble” is grossly inaccurate. The system Demand increases by approximately 2400-2600MW in the 30mins to 1400hrs. The Frequency in the previous 30mins to 1330hrs was struggling to get to 50hz. I have not looked at what Turbo-Generator plant was dispatched but it seems to be insufficient for the rate of change in demand. In other words the system does not have enough inertia. If the largest generator was to trip when the frequency was sc low, the remaining plant with active governors probably would not be able to pick up the loss of generation because it could not even cope with the increase in demand. I suggest that the system was “Insecure.”
The by-now-familiar constraints on transmission from southern NSW towards the load centres north seem to be playing their part in this volatility as well.
A few different constraint equations evident yesterday, such as these:
https://wattclarity.com.au/articles/2024/11/07nov-3dis-manyconstraints/
… you are referring to the ‘N-MNYS_5_WG_CLOSE’ constraint set.
Hi Paul, I am a retired AEMO System Operations Control Room Operator. The statement that it was a “Small Frequency Wobble” is grossly inaccurate. The system Demand increases by approximately 2400-2600MW in the 30mins to 1400hrs. The Frequency in the previous 30mins to 1330hrs was struggling to get to 50hz. I have not looked at what Turbo-Generator plant was dispatched but it seems to be insufficient for the rate of change in demand. In other words the system does not have enough inertia. If the largest generator was to trip when the frequency was sc low, the remaining plant with active governors probably would not be able to pick up the loss of generation because it could not even cope with the increase in demand. I suggest that the system was “Insecure.”
Thanks Ian,
Next step in analysis here:
https://wattclarity.com.au/articles/2024/11/07nov-mainlandfrequency-part2/