Tomorrow, the CEC’s Australian Wind Industry Summit 2024 kicks off in Melbourne (Monday 9th September 2024) and continues on Tuesday.
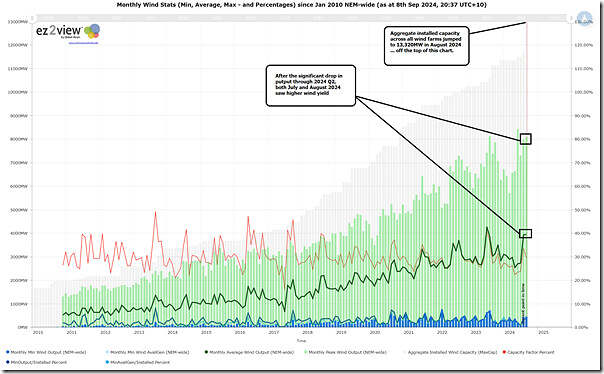
So I thought it would be an opportune time to update this pre-configured query in the ‘Trends Engine’ within ez2view, looking at monthly statistics for NEM-wide wind production, and installed capacity:
In the chart we can see that:
1) Recovering from the wind lull of 2024 Q2, we see both average and peak production levels quite high for July and August 2024.
… though in both cases, not highest ever.
2) We also see a big increase in installed capacity (+1,623MW) hit the books in August 2024:
(a) Up to 13,320MW … off the top of the chart, at this scale
(b) Readers should recall these challenges in assessing installed capacity … in this instance we’re using Maximum Capacity.
(c) Because of the increase in installed capacity in August, we see calculated Capacity Factor for August 2024 being significantly lower than for July 2024 (despite similar levels of output).
Will I see you there?


Readers need to remember that ‘Installed Capacity’ can be a significant overstatement of aggregate windfarm capacity physically able to generate, because for each new windfarm connected, its nameplate Maximum Capacity arrives in AEMO’s systems in one hit whereas actual physical capacity can take up to 12 months to fully commission.
So ‘Installed Capacity’ can be well ahead of actual capacity on the ground, especially when larger new windfarms are being connected and commissioned.
As a consequence, Global-Roam’s calculated fleet “capacity factor” can be materially understated because it is comparing apples and pears – generated output from actually commissioned capacity versus ‘Installed Capacity’ not all of which is actually commissioned and able to generate.
The impact on fleet capacity factor, compared with using an apples and apples approach (eg by excluding newer partially-commissioned farms from the calculation) can be of the order of 2-3 percentage points – eg 30% vs 33%, which is fairly material.