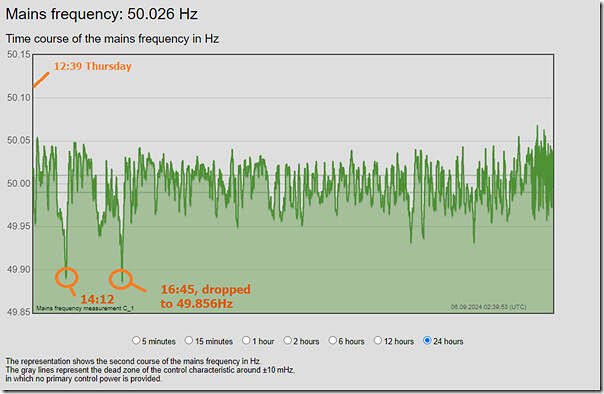
In part because of the drop in System Frequency at ~14:12 in conjunction with the Market Suspension, I had reason to glance at the live System Frequency trace (which we can dial back to look at up to 24 hours), and I saw a second dip in frequency as shown below:
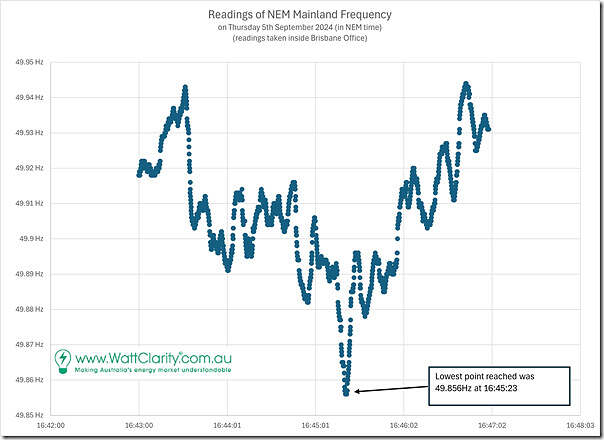
One of our team members extracted the data from around the period of the second drop, and it looks like this if we zoom in:
So, in summary, we see that the frequency was dropping in bursts through the dispatch interval ending 16:45, and then had one more burst downwards (to the lowest point at 49.856Hz at 16:45:23) in the early part of the dispatch interval ending 16:50 before trending back upwards in bursts.
Why do Frequency Drops occur?
In the WattClarity Glossary Page about ‘FCAS’’ we’ve included an illustration of how System Frequency is like a ‘heartbeat’ for the NEM. It normally sits close to 50Hz, and NEM Rules prescribe that it should be maintained within the NOFB (Normal Operating Frequency Band)
Commonly when we see a large drop in frequency we’ll see that there was a large drop in output at a single unit or station (commonly a coal unit if it trips from full load – such as seen on Wed 14th August (with LYA4 trip) and on Mon 19th August (with TNPS1 trip)). But in this instance:
1) I could not find anything like that occurring in the 16:45 or in the 16:50 dispatch interval
2) I also looked in the immediate (time) neighbourhood and could not see any single large change.
Hypothesis (Speculation!) … Was this due to some collective (and relatively rapid) drop in Large Solar?
Warning … here be speculation! Readers should note that what follows is more of a very curious question than any definitive statement of proof!
Maybe I’ve not looked in the right places … but the only thing that jumped out at me was a collective drop in output across many Large Solar Farms in the 5-minute periods ending 16:45 and ending 16:50 …
The 16:45 dispatch interval
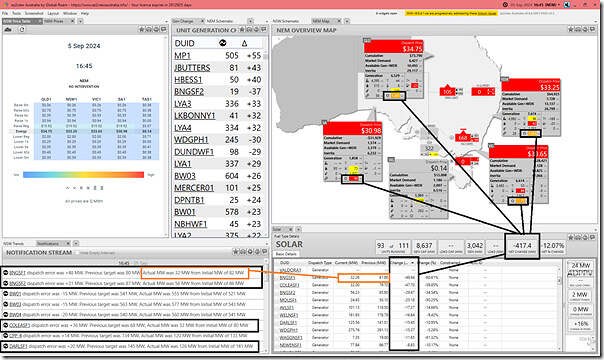
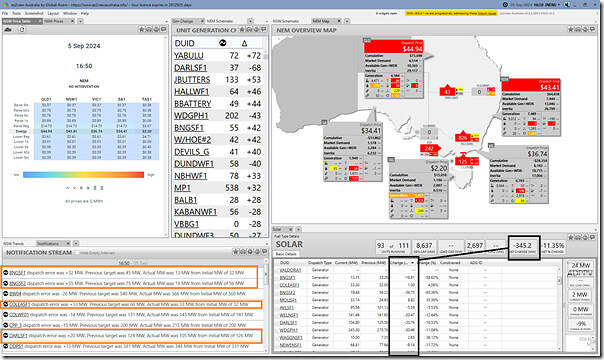
We can see this in this snapshot from ez2view time-travelled back to the 16:45 dispatch interval on Thursday 5th September 2024:
With respect to this image note that:
1) The ‘NEM Map’ widget is lit up with some alert colours, signifying significant change (which can be up, or down) in the collective output of those Fuel Types in those regions in the 5 minute period to 16:45 (i.e. based on FinalMW SCADA readings)
2) The solar contribution in all 4 regions are coloured, collectively pointing to the 417MW drop in Large Solar output across the NEM from 16:40 to 16:45.
… note that solar is declining in the afternoon, so we’d expect it to be dropping … but a change that size is significantly larger than the drops in neighbouring dispatch intervals.
3) In the table of the ‘Solar’ widget:
(a) I have sorted the table in descending order of drop in output (there are a couple farms way at the bottom of the table that increased slightly).
(b) I’ve draw a box around the column that adds to 417MW.
4) Also shown on the left is a list of alerts in the ‘Notifications’ widget that have triggered on ‘Dispatch Error’ in that dispatch interval:
(a) It’s done this based on ‘Next Day Public’ data.
(b) Based on AEMO’s logic, a positive number is underperformance compared to target.
(c) but, because its coded to work in Real Time for clients who have Private Data in Real Time:
i. these alerts are triggered when alerting for the prior (i.e. 16:40) dispatch interval.
ii. because that’s the one with FinalMW already published
iii. though perhaps we should be switching this logic (i.e. to show the current dispatch interval) when Time-Travel is used?
(d) As an aside, note that ‘Dispatch Error’ is one input into the ‘Raw Off-Target’ metric we have written about elsewhere
… particularly in relation to an escalating incidence of large collective underperformance across all Semi-Scheduled units.
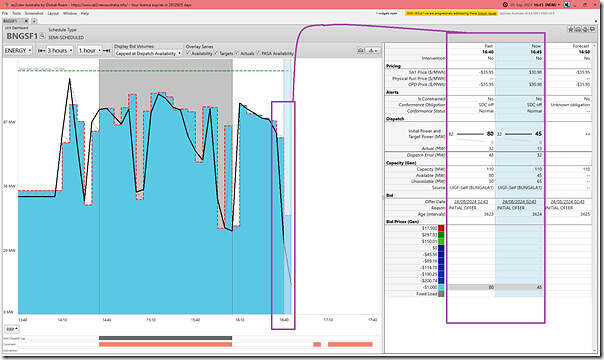
5) To illustrate this, I’ve drilled into BNGSF1 (i.e. Bungala Solar Farm 1 happens to be top of the list) in the ‘Unit Dashboard’ widget in ez2view:
In this case we can see that the Dispatch Error for the preceding (i.e. 16:40) dispatch interval was +48 MW, whilst the Dispatch Error for the 16:45 dispatch interval was still significant (at +32 MW) but somewhat smaller.
The key point of the Dispatch Errors show is that these were unexpected by the AEMO in terms of making supply and demand balance inside of NEMDE. We can see in the window above that there were several Solar Farms with large unexpected underperformance in the five minutes ending 16:40 … so what about 16:45?
The 16:50 dispatch interval
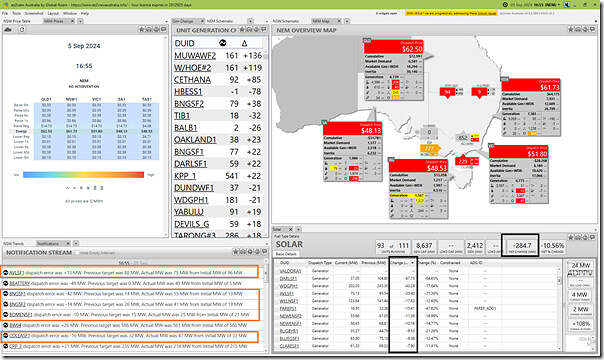
Here’s that ez2view window stepped forward again to the 16:50 dispatch interval on Thursday 5th September 2024:
I’ve highlighted two things in this window:
1) On the right, we see the collective drop in output from Large Solar was 345MW :
(a) So not as large as in the 5 minutes to 16:45, but perhaps compounding on the decline in frequency seen already underway?
(b) But to what extent was this drop unexpected?
2) On the left we see a few alerts for ‘Dispatch Error’
… but remember again these are for the prior Dispatch Interval (so now the five minute period to 16:45)
The 16:55 dispatch interval
Here’s that ez2view window stepped forward again to the 16:55 dispatch interval on Thursday 5th September 2024:
Note here that some of the Dispatch Errors for Large Solar Farms (which really pertain to the 5 minute period ending 16:50) are unexpected increases in output compared to Target.
… including for BNGSF1 and BNGSF2.
So, in summary, contributions from Large Solar dropped by large (collective) amounts through these dispatch intervals … but the extent to which the increases were larger (or smaller) than expected is not clear from the above.
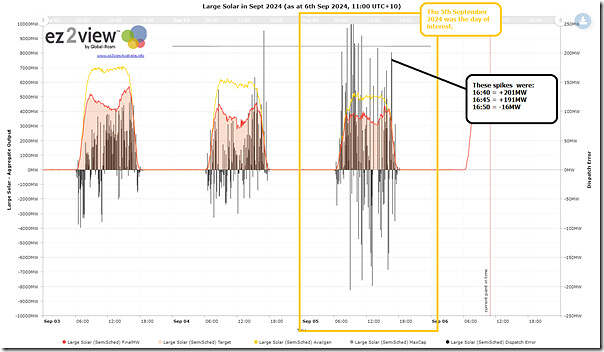
So using the ‘Trends Engine’ within ez2view I created the following chart:
We can clearly see Aggregate ‘Dispatch Error’ jumping all over the place through Thursday 5th September 2024 (presumably as cloud cover took its toll). Of particular interest were the aggregate results for the five minute periods:
1) Ending 16:40 (‘Dispatch Error’ = +201MW, so collective underperformance, as frequency drops)
2) Ending 16:45 (‘Dispatch Error’ = +191MW, so collective underperformance, as frequency drops)
3) Ending 16:50 (‘Dispatch Error’ = -16MW, so collective overperformance, as frequency starts to climb again after the lowest point at 16:45:32 at the start of the dispatch interval)
Perhaps underperformance of solar (compared to expectations) did contribute to the second frequency drop seen just seconds after 16:45 Thursday 5th September 2024?
Once again, the above is all hypothesis/speculation … so most interested in hearing from the more knowledgeable readers here!
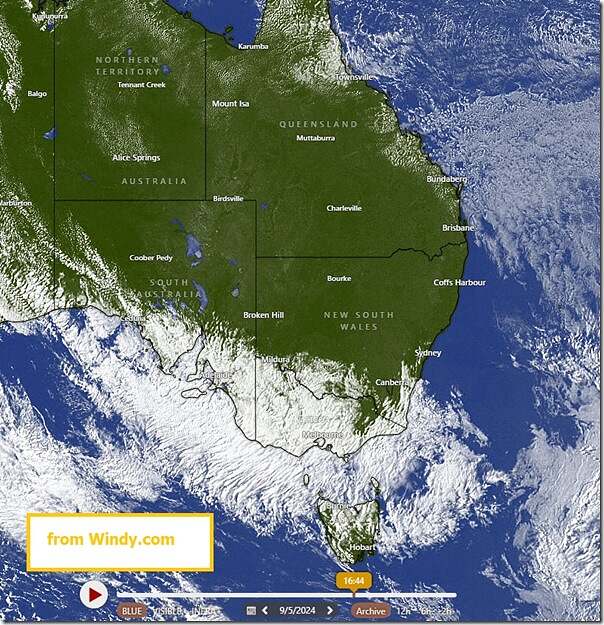
What was the cloud pattern?
In a conversation with someone from Overwatch Energy about this, they have helpfully provided me this image from Windy.com time-travelled back to 16:44 yesterday, showing cloud cover extensive across VIC and SA:
Did rooftop PV output also drop … faster than expected?
Note that Rooftop PV data is quite limited in its usefulness for this type of investigation (they are estimates in any case, and AEMO estimates are only of 30-minute cadence in any case). So I can’t really see much point in trying to look, at this point.


Be the first to comment on "There was a second drop in System Frequency on the Mainland (at ~16:45) on Thursday 5th September 2024"