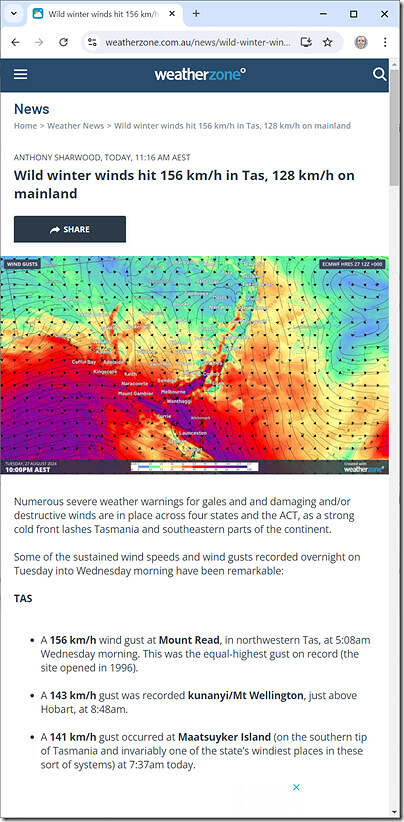
I couldn’t help but notice the Weatherzone article ‘Wild winter winds hit 156 km/h in Tas, 128 km/h on mainland’ whilst eating lunch:
Without scrolling further, to see the wind speeds on the mainland, that’s clearly some impressive wind speeds (which had been predicted earlier).
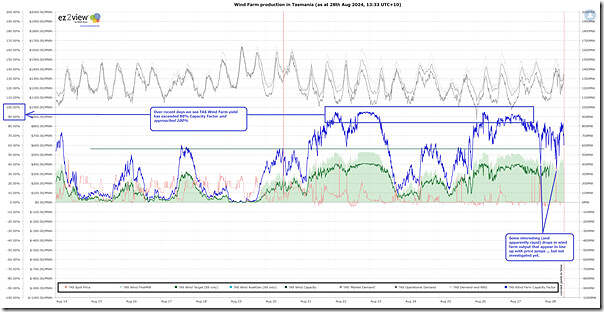
Naturally I wondered what that was meaning, in terms of aggregate yield from the (small but growing) number of Wind Farms on the island … so quickly threw together this trend using the ‘Trends Engine’ function within our ez2view software:
There are various things that can be seen in this trend:
1) Headline is that there were periods where aggregate capacity factor has gone quite close to 100% on an instantaneous basis:
(a) such as on 21st August, 22nd August and 23rd August
(b) and on Monday 26th August, Tuesday 27th August and today (Wednesday 28th August).
2) Also of interest were a few drops in wind output (that look quite sudden, in the scale of the chart) that are lined up with price volatility:
(a) I’ve highlighted two in the past ~24 hours
(b) I wonder, given the wind speeds, whether there were any cases of high wind speed cut-out (but have not yet looked).
That’s some impressive wind speeds, and outputs!


A most interesting generating frenzy. Paul as Tasmania’s wedge tailed Eagles are an endangered species how about a regular story on their deaths at our glorious windfarms.