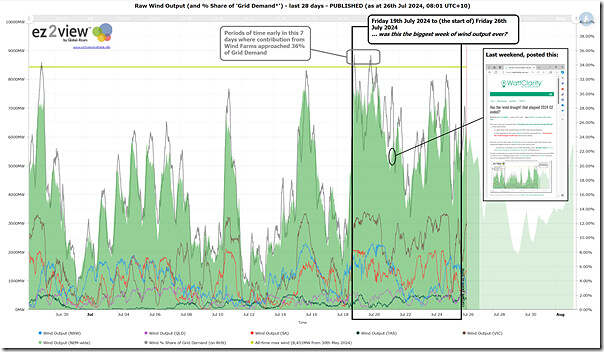
Last weekend I asked ‘Has the ‘wind drought’ that plagued 2024 Q2 ended?’ … though Craig, in his answer, thought too early to tell.
Over the following days the strong wind yields have continued (it’s only briefly dropped below 4,000MW on two occasions) – as we see in this updated snapshot from the same pre-configured query in the ‘Trends Engine’ behind our ez2view software, we see how aggregate NEM-wide wind production fared:
Those with a licence to the software can open their own copy of this query here.
I’ve highlighted a 7-day span beginning (roughly) at midnight beginning Friday 19th July 2024 through until midnight beginning this morning (Friday 26th July 2024) and pose what’s really a question-on-notice to ourselves … does that represent the largest ever 7-day production from wind in the NEM?
… a question one of our team might have time to explore further at some point in future.
Remember that it was on Monday 22nd July (three days into the run) that Ashleigh Madden wrote about ‘Another Windy Week’ on Weatherzone.


Too bad it doesn’t last. The blocking high expected to impact for the next 5+ days will see a significant reduction in windfarm output.
As usual when it comes to real life, it’s not the peak performance but the minimum output amounts that truly matter as peaks are often short lived.
More batteries will help a little, but those 4 to 5 day low wind output events are going to be the largest challenge for SE NEM to transition to 100% RE.
The quick answer about highest 7-day average is yes, by a long way. Midnight to midnight, 19-25 July averaged over 5,950 MW, 600-odd MW up on the previous high in July 2023.
Someone raised a point about minimums. Those have increased as well – the Q2 2017 calm period saw a minimum 7-day average of 420 MW. This Q2 the minimum 7-day average was 1,320 MW.