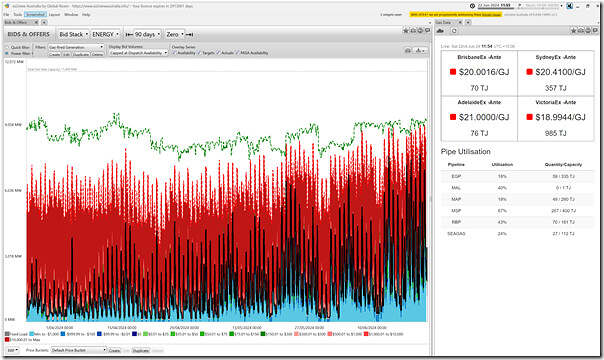
A short article today with this snapshot from ez2view at the 11:55 dispatch interval highlighting two widgets:
Of these two widgets:
1) On the left is the ‘Bids & Offers’ widget:
(a) this has been filtered down to show bids just for gas-fired generation and looking back the past 90 days
(b) remembering that, across all types of supply sources, we have seen a declining volume of bids in green (i.e. bid between $0/MWh and $300/MWh) it’s not so much of a surprise to see almost no volume from these generators bid in the green range;
(c) we can clearly see through Q2 two things:
i. An escalating daily volume of production from gas-fired generation, right across the NEM; but also
ii. A very ‘peaky’ daily load shape for these generators … no surprise for guessing that these peaks typically occur during evening periods … with the highest being the recent low IRPM evenings in the week just passed (Monday 17th June, Tuesday 18th June , Wednesday 19th june, Thursday 20th June … noting there was a reprieve in terms of IRPM on Friday 21st June)
2) On the right is the ‘Gas Map’ widget, which has resized down to a table in this smaller space … but still showing the current spicy prices.
That’s all for now…


Be the first to comment on "Trended bids (and production) from gas-fired generation over the past 90 days"