Earlier today we posted ‘Aggregate Dispatch Error across all Semi-Scheduled units (NEM-wide) throughout Thursday 22nd February 2024’ in the process of fleshing out some analysis about ‘Aggregate Raw Off-Target’ for all Semi-Scheduled units for the latest iteration of our GenInsights Quarterly Update series.
In that article:
1) we flagged four particular dispatch intervals with Aggregate Dispatch Error calculating out as above 500MW across all Semi-Scheduled units (i.e. collective under-performance greater than 500MW compared to Target).
2) of those four particular dispatch intervals, the largest deviation was at 14:15 NEM time (Aggregate Dispatch Error = +653MW).
(a) Which you can see shared referenced historically is a large (but not the largest instance)
(b) Indeed, is not even the largest in 2024 Q1 … but interesting for other reasons…
A quick scan across all Semi-Scheduled units
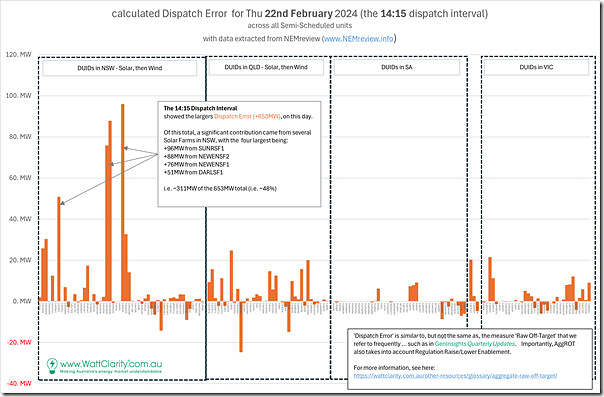
Let’s start with this graphical representation of the calculated Dispatch Error for all Semi-Scheduled units that were operational at that time (there were 167 x units):
We’ve organised these units firstly by region (as shown) then dividing Solar and Wind, and then alphabetically by DUID … though I won’t expect you to read the DUIDs, as they need to be super-small to list them all.
What’s particularly noticeable is that:
1) Of the units, there are far more instances of under-performance than over-performance
… which (as noted before) is not a surprise given the one-sided way the Semi-Scheduled category works.
2) Particularly with respect to large deviations, there are 4 x Solar Farms in NSW that contribute about half of the +653MW underperformance.
(a) So it’s logical to wonder if there was some weather effect that impacted output at these units.
(b) Also worth noting that the 14:15 dispatch interval was the first of the four large deviations noted through the afternoon.
Four NSW Solar Farms with large deviations
Reaching for the ‘Unit Dashboard’ widget in ez2view and time-travelled back to the end of the day on Thursday 22nd February 2024 but looking backwards 24 hours, we’ll walk through each of these DUIDs in sequence.
We’ll walk downwards in order of significance:
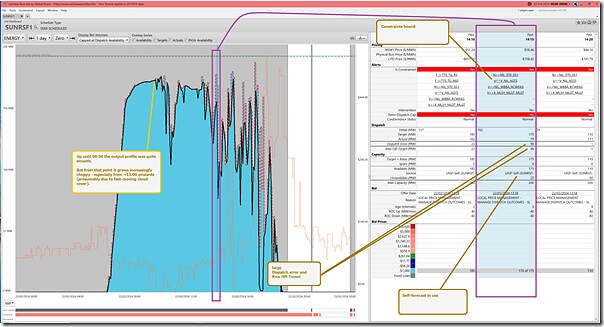
Sunraysia Solar Farm (SUNRSF1)
With this snapshot it’s quite apparent that the output pattern through the morning was quite smooth, but then quite choppy through the afternoon:
In this view, and the three below, we can focus the table on the 14:15 dispatch interval by selecting in the chart. The key point here is that the output profile through the afternoon was particularly choppy, suggesting fast-moving cloud cover that:
1) Particularly affected solar output at times;
2) But was difficult to accurately forecast … in this case by the self-forecast that was in place at the time.
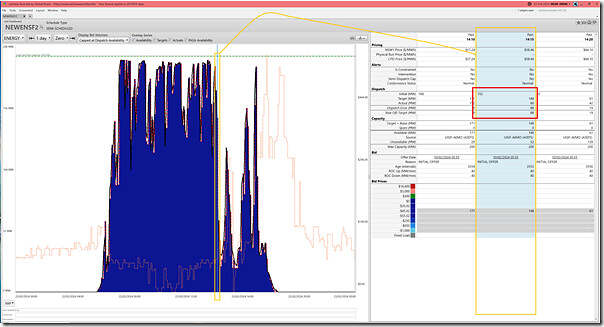
New England Solar Farm 2 (NEWENSF2)
Second largest individual under-performance for this dispatch interval was for New England Solar Farm 2, as seen here:
In the case of the NEWENSF2, unit output had been reasonably full through the morning (albeit choppy), but fell away unexpectedly entirely from the 14:15 dispatch interval.
No self-forecast was in use here, so it was the AEMO’s ASEFS forecast that did not keep up.
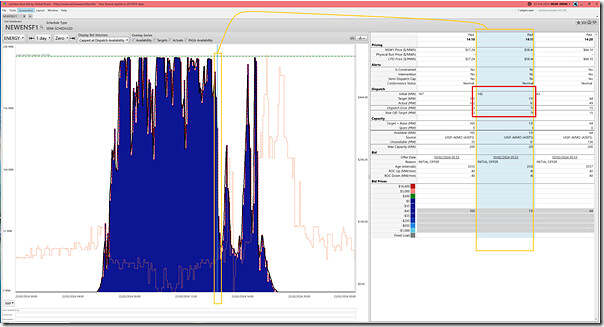
New England Solar Farm 1 (NEWENSF1)
Given that this was due to weather changes, it’s no surprise that the sibling NEWENSF1 also saw the same issues:
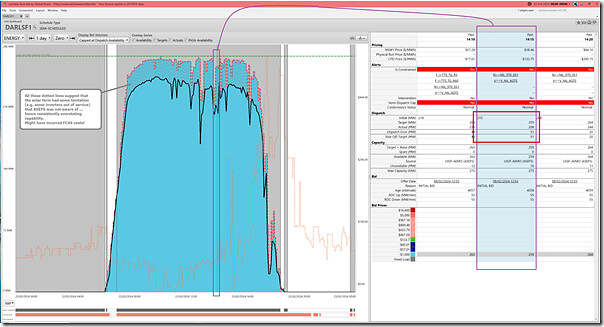
Darlington Point Solar Farm (DARLSF1)
Darlington Point Solar Farm is located at the other end of NSW compared to New England, and the picture looks a bit different here:
In this case the situation seems to a different cause:
1) First and foremost, the unit appears to have suffered from some technical limitation onsite all day:
(a) Such as from inverters out of service … but which ASEFS did not know about
(b) Such that ASEFS availability forecasts are seen (via the consistent pattern of dotted grey lines) to be overstating availability by 25MW-30MW each dispatch interval
(c) Which will have probably worked its way through to higher Regulation FCAS costs for the unit as a result.
2) On top of this, there appears to have been a bit of cloud activity that has exacerbated the deviation for the 14:15 dispatch interval.
Remember that these four units contributed about half of the collective under-performance … but that each of the (143) other units also has a story that could be told with the ‘Unit Dashboard’ widget in ez2view. But not today …


Be the first to comment on "Case Study of 14:15 on Thursday 22nd February 2024 (large collective under-performance across all Semi-Scheduled units)"