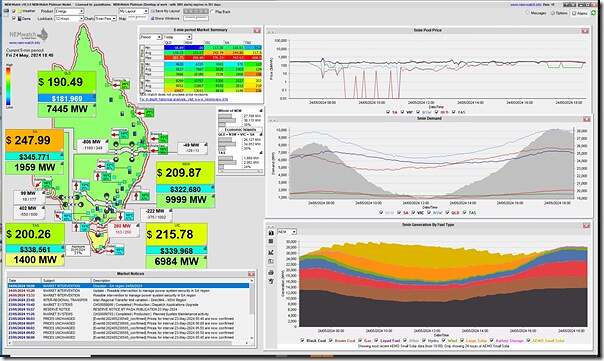
Yesterday we posted ‘NEM-wide aggregate wind yield under 500MW on Thursday evening 23rd May 2024’ which:
1) Was topical, given the release of the update to the 2023 ESOO and then the announced extension to service for Eraring;
2) But also made me wonder what we’ll find when we update these long-range stats for wind production. in the coming weeks (i.e. after we’ve seen May in its entirety).
A short follow-on with this snapshot from NEMwatch at 18:40 on Friday evening 24th May showing similarly low conditions through the day today, which (though ramped up slightly this evening after sunset) are still quite low from an instantaneous capacity factor perspective:
As noted yesterday, those not so familiar with the machinations of the NEM should recall that low wind might be a result of a combination of factors:
1) Including, of course, low underlying resource for wind;
2) But also including curtailment (for network or economic reasons), as Dan illustrated here with respect to 8th May 2024 in NSW.


Given the prices prevailing I can’t see too much economic curtailment happening. Good coin to be made. Bottom line is the wind simply isn’t there. So how about someone doing a quick integration under the curve to work out how much wind overbuild, solar and storage (GWhr + MW)) is needed to keep the lights on for the last few weeks once all the nasty black and brown curves aren’t there….and then do a quick calculation of the costs. The number will be eyewatering. Then perhaps a visit to Canberra.
NSW has gone out to tender for 1 GW of LONG duration energy storage – in NSW the term long duration can be as short as 8 hours. What energy source will charge the 1 GW of long duration storage when wind droughts go for days or weeks and coincide with low solar output?? Its not just a case of the price to charge, its whether there is energy to charge. Sadly, the general public think batteries and pumped hydro are a like for like replacement for coal and gas generation. A position the general media is only too happy to promote.
It wasn’t just low on the Friday. It was low for the whole week, in fact, the lowest it has been in five and a half years.
I have now kept detailed daily and weekly records for wind generation for the last 295 weeks, more than five and a half years, and this most recent week ending yesterday, 26May was the lowest power generation across a whole week that there has ever been. Because that Nameplate increases regularly, then it stands to reason that delivered energy (in GWH) to the AEMO grid increases. So, the only comparison we have over time (taking that Nameplate increase into account, now an increase of 6108MW from my start point of 5301MW back in October 2018) is that all important indicator of Capacity Factor, (CF) where you actually can compare week to week.
That CF for the last week was just 10.33%, the lowest that figure has ever been for a full seven day week. The long term average CF for all wind generation here in Australia is just 30%, so when it is this low, then questions need to be asked. Only twice in those last 295 weeks has the weekly CF been below 20%, and the lowest prior to this week was 17%, and that was four years ago now.
Capacity Factor has been falling consistently every week now for more than 30 weeks, a loss of half a percentage point, and that’s pretty big considering that the full maths calculations are across 295 weeks. 30 weeks back, it was 30.41%, and now it is 29.90%, and the last time it was lower than 30% was also that four years ago. Perhaps the more worrying trend in all of this is the most recent 52 week CF percentage. As more efficient and larger turbines come on line, then you might think that they would tend to raise the CF figure. However, the exact opposite is happening, with that recent CF percentage for the last year now coming in at 28.7%, a full 1.2% LOWER than the overall long term percentage.
And hey, has nobody put together the fact that wind is low when those huge High Pressure weather systems hover over that area where two thirds of all Australian Nameplate for wind power is located, in SE South Australia and Central Western Victoria. Have a look at power generation for wind this last week, and then correlate it with the Synoptic weather maps. that looks a little like an ‘Uh Oh’ moment to me. Why place so much wind in that one area, and then watch as the bottom falls out of power generation with every ‘High’ that comes across.
Anton Lang.