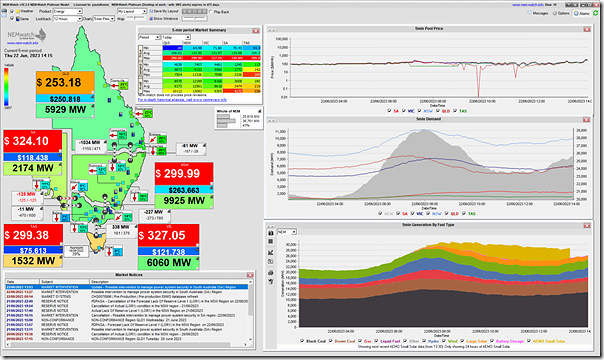
A quick note with this snapshot from NEMwatch at 14:15 highlighting some (increasingly rare) pricing activity in the middle of any afternoon:
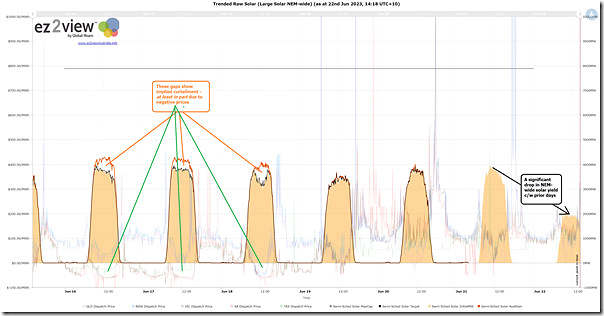
One factor contributing to this would be the drop in solar generation compared with prior days.
Here’s a view for Semi-Scheduled generation showing current levels ~1,500MW or more lower (a pre-prepared trend widget in ez2view):
… but keep in mind that there’s a much larger yield from rooftop PV that is similarly depressed.
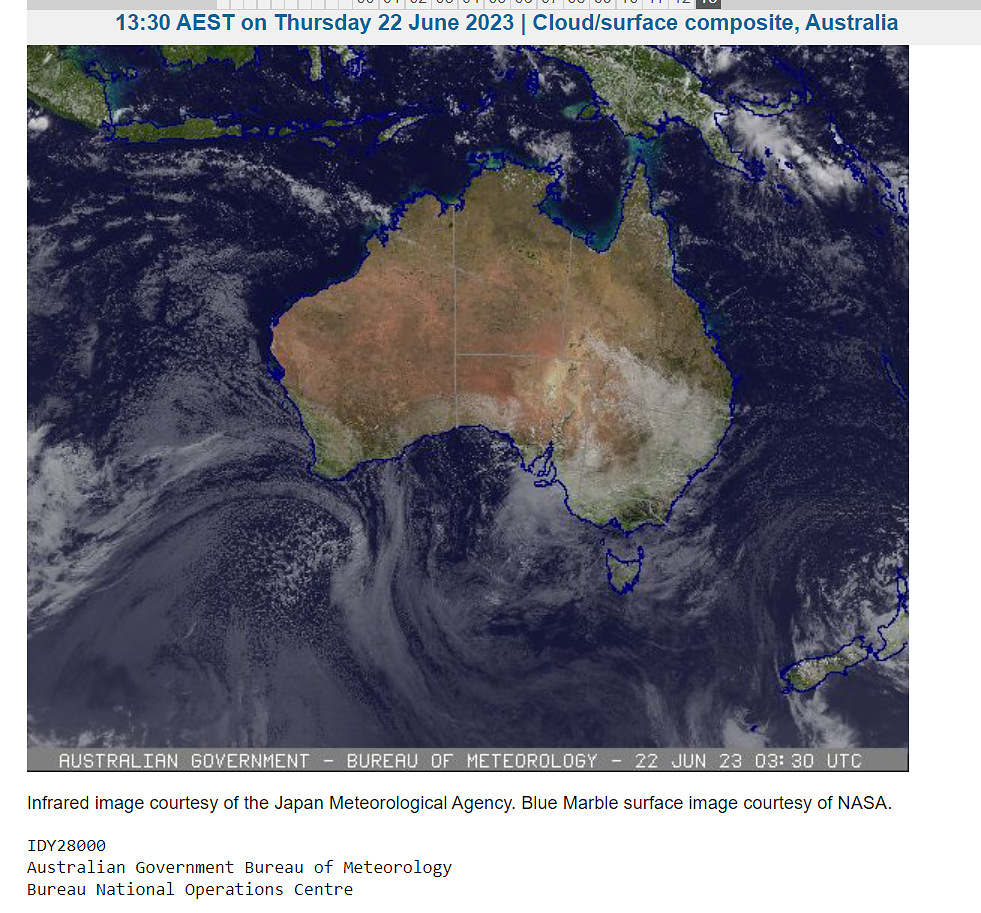
Here’s a current snapshot of the BOM’s cloud map – whilst clouds clearly visible in southern half of the NEM, the northern solar farms in QLD don’t look like they are covered:
Not shown here, but seems to match with a quick look through each of the 4 x Regional Schematics in ez2view (i.e. no Large Solar farms to look at in TAS).


It seems that solar sets the price effectively until the next bid kicks in at around and is capped by thermals at $300