Back at work today after a short break, and keen to finish off the Generator Statistical Digest 2019 in order to get the first copies out to those who have pre-ordered – but I could not resist wondering at how the dust* storms experienced yesterday across western NSW impacted on production from solar farms located out in the west.
* or “soil storms” if you use that term
Yesterday I had noticed this tweet from Lucy Thackray which gives some sense to the size, and density of the storm:
What jumped out at me (as a NEM junkie) was the location name Nyngan, which is also the name of the AGL PARF solar farm constructed as one of the first ones in the state.
The dust storm also made the mainstream media – such as here on NewsCorp, and here on SMH.
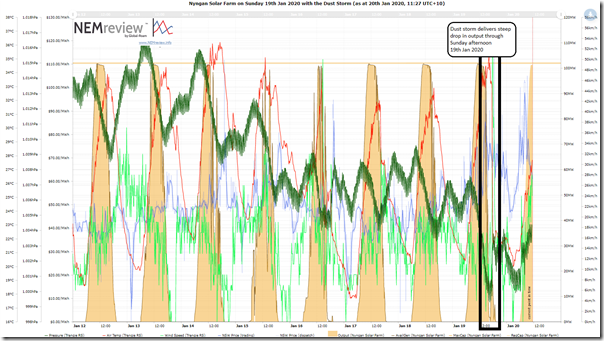
Opening up NEMreview v7 and preparing this query, I was able to have a look at how the output of the Nyngan Solar Farm has varied over the past 8 days (click on the image for a larger-screen view):
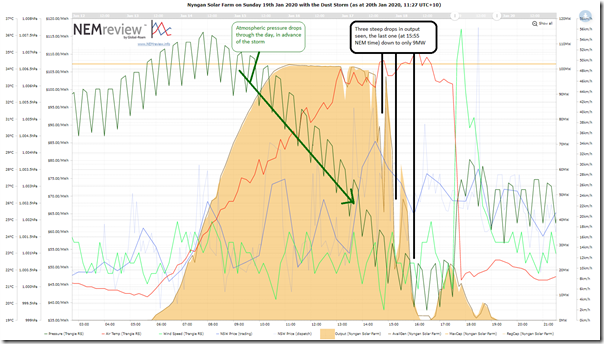
I’ve highlighted yesterday afternoon on the chart, and present a zoomed-in view below. One of the objectives of presenting the data above was to show that there have been other times displaying steep drops in output (such as on 14th January), but I don’t have time to explore further today:
As can be seen in this zoomed-in view, there were actually three occasions through the afternoon where the output dropped significantly:
1) In 15 minutes to 14:45 (NEM time) the InitialMW dropped by 40MW
2) In 20 minutes to 15:10 the InitialMW dropped by 73MW
3) In 5 minutes to 15:50 the InitialMW dropped by 27MW, and then kept falling to 0MW and remained there for some time – much earlier than expected for sunset.
Perhaps one of our readers can tell us (in a comment below) which one correlates to the monster of a dust storm recorded above – or were there several waves in a storm that lasted a number of hours?
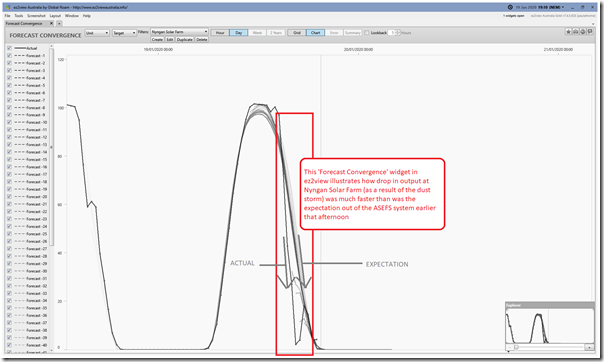
It’s too early for AEMO to have published its P5 predispatch data (Available Generation and Target) for individual DUIDs, but we can use the ‘Forecast Convergence’ widget in the installed ez2view to provide this illustration of the challenges that AEMO faced
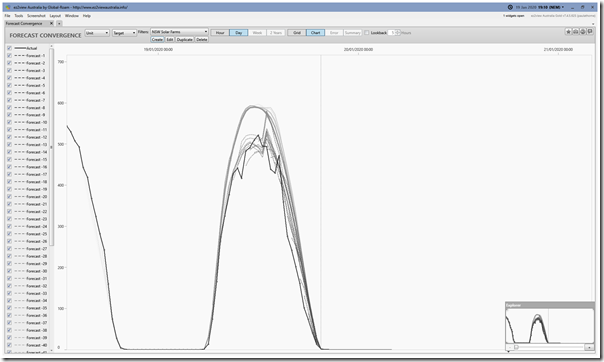
Expanding the filter to look at all solar farms in NSW shows that there was an aggregate gap between expectation and reality of between 100MW and 200MW through the afternoon (i.e. so not all solar farms affected by the dust) – and also that the peak output earlier that afternoon was lower than the initial forecasts (for perhaps reasons in addition to the dust storm):
In this short article I’ve just had time to look at the impact on output yesterday. It seems likely that solar farms (incl Nyngan) in the affected areas would now have a coating of dust over the panels, which would (I presume) affect output – but not be (I believe) taken account of in the ASEFS forecasting system for output in the coming days.
Perhaps if I had time later, I might be able to look back and see if there was any noticeable longer-term effect….


Leave a comment