A quick post this evening with the temperatures and humidity still uncomfortably sticking around to have a quick look at what we can see quickly through some of our software products after a day that saw (amazingly) only the first major price spikes of summer 2017-18 in the QLD region.
(A) Recapping Saturday 13th January 2018
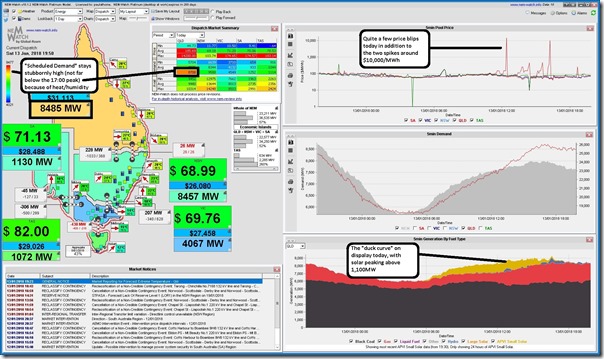
As a starting point, let’s start with the obligatory snapshot from NEM-Watch v10 (our entry-level dashboard to the NEM) from 19:50 NEM time (which is 19:50 in Brisbane):
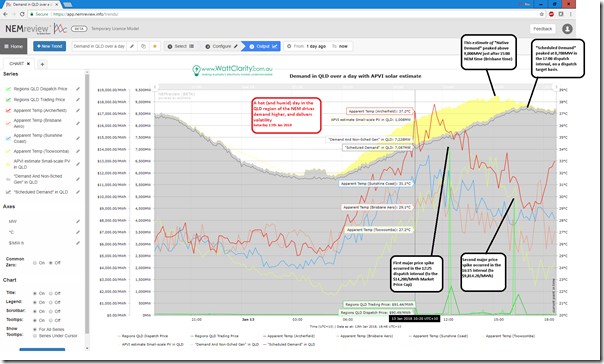
Experimenting with the early-release beta of our NEMreview v7 software (which clients have been benefiting from for many months) I was able to put the following chart together looking back over the past 24 hours:
NEMreview clients who wish to access this chart can do so through the template linked here – just log in with your individualised access. I’ve noted in the image the two most significant price spikes that occurred on the day (though note that prices were elevated throughout the day, as noted in the NEMwatch image above):
1) At 12:15 the QLD dispatch price spiked to $14,200/MWh (the Market Price Cap for the 2017-18 financial year); and
2) At 16:15 the QLD dispatch price spiked to $9,814.20/MWh.
These two spikes were (amazingly!) the first major price spikes in the Queensland region this summer. The other mainland regions have been similarly subdued, though Tassie has seen a couple in December.
Both spikes make me ponder what might have been the case (in terms of speed of supply-side response) had we already been operating with 5-minute Settlement. I see (but don’t note on the chart) what appears to be some reduction in demand in response to these prices – but this seems smaller than in some prior years (I know of some energy users who have reduced consumption in general terms, and so are not available to provide demand response like that, because of escalating prices).
Also noted in the NEMreview trend for today, Scheduled Demand peaked up at 8,708MW in the 17:00 dispatch interval. Scheduled Demand is what we chose to include in NEM-watch v10 because it is the demand that the AEMO “sees” in dispatching scheduled generators to keep the balance between supply and demand.
This peak in Scheduled Demand occurred coincident with (and partially because) the estimated injection from small-scale solar PV across the state wound back to close to zero, by combination of late in the day and also cloud bands thankfully passing through. Also noted on the chart is an estimated peak in “Native Demand” (closer to what a layperson might think of as electricity demand – being the aggregate rate of electricity used by everyone, no matter where supplied from). Interestingly this is shown to occur a couple hours after the apparent temperatures peaked at the Brisbane airport and Archerfield. What would have been the final result had the temperatures not backed off somewhat through the afternoon?
Well, we might experience that tomorrow…
(B) Looking forward into Sunday 14th January 2018
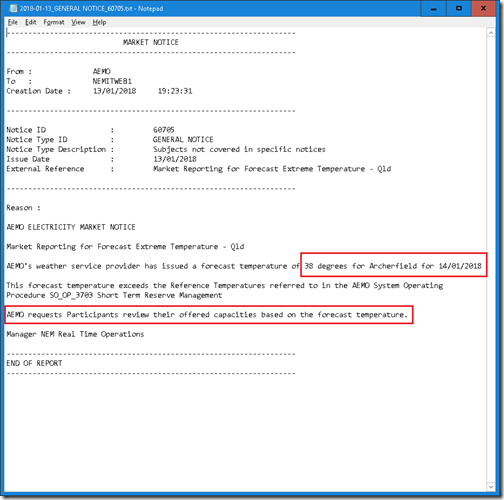
Note highlighted in the NEM-Watch v10 image above the Market Notice issued by AEMO at 19:23 for forecasting extreme temperatures in the Queensland region. Here’s the full text of the notice:
With the temperature high, and probably the humidity as well, the capability of different generators will be affected in different way (in terms of output capability). This is why AEMO is calling on generators to review the capacity they offer to the market tomorrow through their bids.
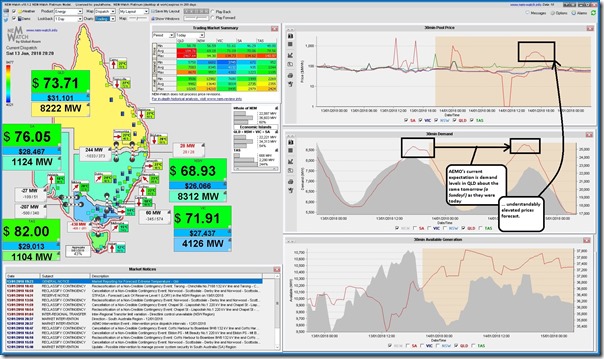
Flipping the charts in NEM-Watch to “Trading” to show AEMO’s P30 predispatch forecasts, we see AEMO’s current expectation (as at 20:20 NEM time) is that the demand will peak up at 8,670MW in the 17:00 trading period – so effectively just as high as today, which is noteworthy given that this is for a Sunday, which normally has lower levels of demand:
Let’s find somewhere cool for tomorrow…


Leave a comment