It seems the National Electricity Market is copping it from many sides in recent times.
Today I see this article by Simon Benson in the Australian, noting the threat to fuel supplies at Mt Piper coal-fired station in NSW – stemming from effect of a NSW Court of Appeal decision regarding planning consent granted for the upstream Springvale coal mine (operated by Centennial Coal) which is, according to the article, the sole supply of coal to the station.
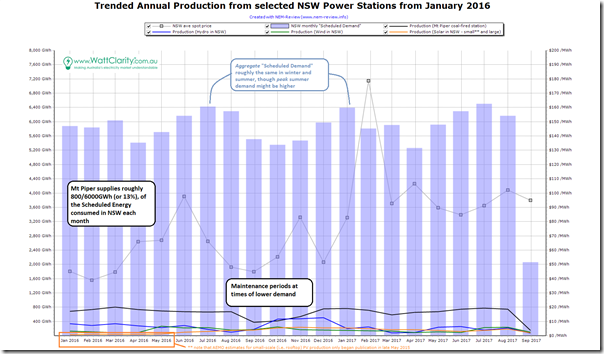
We’re busy with other things today, but I did quickly throw together the following chart from NEM-Review v6 to illustrate the scale of the problem – showing the annual monthly production from the station alongside aggregate “Scheduled Demand” (i.e. the demand met by AEMO dispatch in the NEM, so not including non-scheduled and behind-the-meter plant):
As noted on the chart:
1) Each month Mt Piper supplies roughly 13% of the “Scheduled Energy” consumed by customers in NSW;
2) For comparison purposes I have added each of three other fuel types on the chart, as they will inevitably come up in conversations surrounding the shorter-term risks, and also the longer-term realities of the “great coal closure”:
(a) Hydro in NSW includes the NSW region “share” of the Snowy scheme – so excludes production from Murray
(b) Wind production is aggregate for all wind farms clustered around the southern half of the state (including those farms that Joe Hockey loves so much)
(c) Solar is aggregate small scale + large scale, but note the caveat that data from small-scale estimates only available since June 2016 (despite ARENA funding of the APVI numbers that we don’t have permission to include) and also that the small-scale numbers are also behind-the-meter, so would also be additive to “Total Gross Consumption” (i.e. on top of what is shown as “Scheduled Demand”).
No time for more, at present.


Be the first to comment on "How significant would it be, if Mt Piper were forced to close (at least temporarily)?"