Our competition this summer is actually 7 separate competitions, with 7 separate prizes.
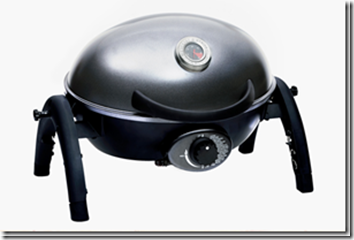
In Competition #2, to be in with a chance to win a “Ziegler & Brown Portable Grill” from Barbeques Galore (shown below, current price $299), you need to forecast what the peak Regional Demand for Queensland will be
(a) measured on a Dispatch Target basis;
(b) for the period 1st December 2014 through to 31st March 2015:
To place your entry, it’s as easy as emailing summer@global-roam.com with the key number (being your forecast for what the peak QLD demand will be).
Don’t forget, with each of Competitions #2-#7 (i.e. including this one) that you can enter once each day up to, and including, Friday 8th January 2015.
The following tips will help you use NEM-Watch (just run a free 7-day trial to start) to get a sense of what a reasonable entry might be:
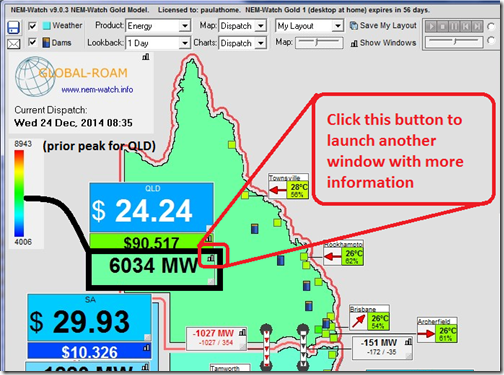
1) The QLD Region is colour-coded, and shows prior peak
Each region is colour-coded on a sliding scale between dark blue (around the minimum demand experienced in recent years) and red (being the highest demand the region has experienced, when measured on the same basis. Very useful for keeping watch on how summer unfolds in your peripheral vision whilst focusing your attention on your core work.
This is seen here in a snapshot from NEM-Watch this morning:
If you click on the regional demand box, the legend on the left will show you the numbers used to set the colour-scale for that particular region.
2) Drill-in to see the 9 x summer forecasts provided by AEMO
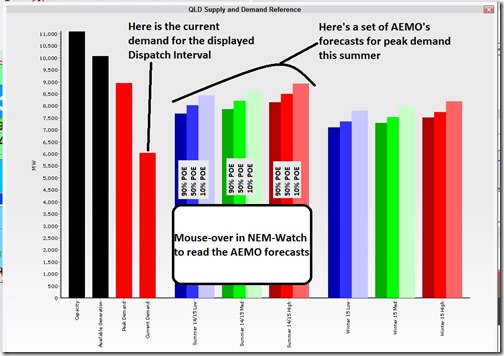
For further insight into what AEMO forecast this summer’s peak demand to be under 9 different scenarios in their most recent Electricity Statement of Opportunities (ESOO), NEM-Watch provides ready access to these forecasts – just click on the button highlighted in the image above to launch the “QLD Supply and Demand Reference” chart:
The 9 bars shown for summer 2014-15 represent AEMO’s 10%, 50% and 90% probability of exceedence (POE) forecasts for each of three different economic growth scenarios (high, medium and low).
(a) By viewing all 9 forecasts from the AEMO, together with the prior record, you’ll begin to see the ballpark within which most forecasts will be expected to land.
(b) Matching all three together (i.e. current demand, historical peak and forecast peak) provides a way of tracking how summer unfolds.
We trust you’ll find this useful in now emailing your entry for today.


Leave a comment