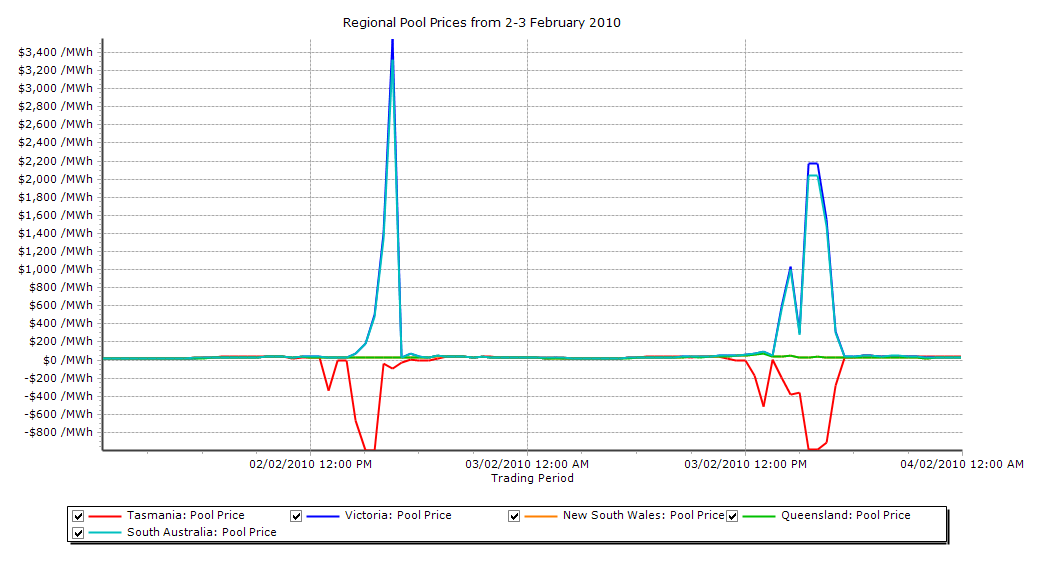
On the 2nd and 3rd of February this year prices spiked in South Australia and Victoria in the afternoon (the events of February 3rd can be seen in a video in a previous article – Playback of high prices in SA and VIC). Coinciding with these spikes, the Tasmania pool price went negative, close to the Market Floor Price (-$1000/MWh). In this article we take a look at the effects and possible causes of the negative prices.
For AEMO’s summary of the events, see the Pricing Event Reports for the 2nd and 3rd of February (at the bottom of the page).
The graph below shows the two occurrences of negative prices in Tasmania (click to view full size):
The following analysis was put together using our latest version of NEM-Review (v6) to gather data, perform some calculations and generate graphs.
Please note that this analysis is based only on the spot market and does not take into account any contracts Hydro Tasmania or AETV Power may have in place.
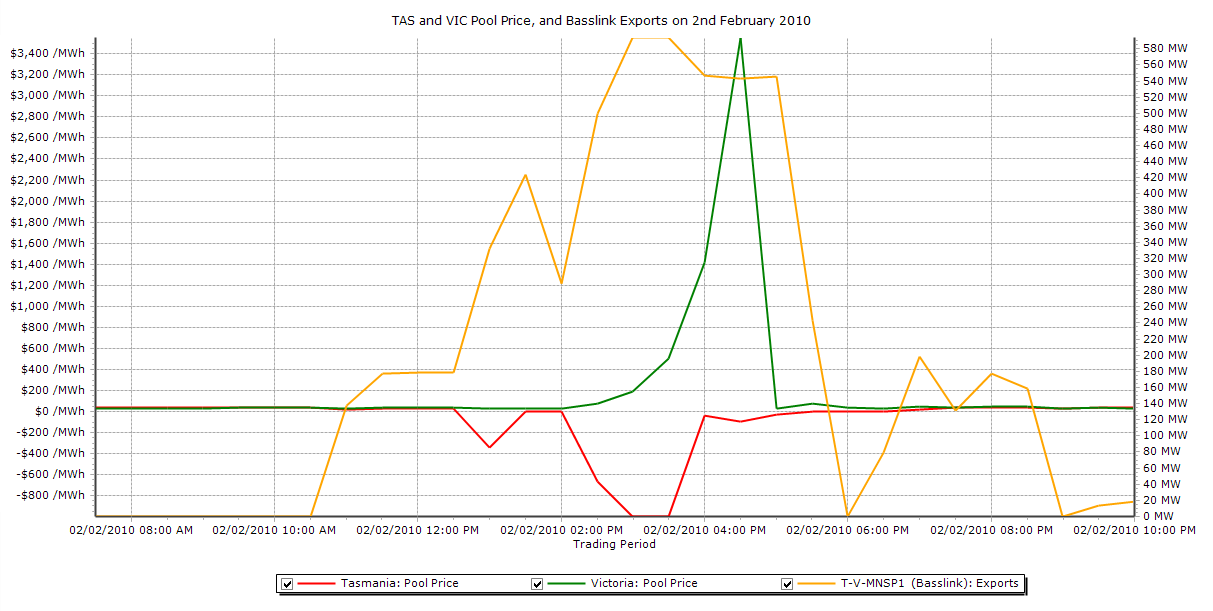
Tuesday 2nd February
As a result of the very low negative prices (reaching down to -$999/MWh) the average pool price for the 2nd was -$44/MWh, and the Tasmanian generators made negative total revenues for the day.
| TAS Daily Average Pool Price | -$44/MWh |
| TAS Daily Average Demand | 1,099MW |
| TAS Daily Total Demand | 26,373MWh |
| Hydro Tasmania Daily Total Revenue | -$2,132,831 |
| AETV Power Daily Total Revenue | -$97,887 |
| Basslink Daily Total Revenue | $2,474,951 |
Note that Basslink’s revenues are around $2.5M, boosted by exporting to Victoria while the pool price there was high and the Tasmanian pool price was negative.
The following table shows the approximate revenues earned by Hydro Tasmania, AETV Power and Basslink during the Dispatch Intervals (half hour periods) in which the Tasmanian pool price was negative (13:00-17:00 and 18:00-18:30). Basslink buys power from Tasmania (at the TAS pool price) and sells to Victoria (at the VIC pool price). Hence the revenue earned by Basslink in each half hour can be approximately calculated as:
Basslink Revenue = ((Basslink Exports x VIC pool price) – (Basslink Exports x TAS pool price)) / 2
Note: the division by 2 gives the total revenue for the half hour (as opposed to a whole hour)
| Dispatch Interval | TAS Pool Price ($/MWh) |
VIC Pool Price ($/MWh) |
TAS Demand (MW) |
Basslink Exports (MW) |
Hydro Revenue ($) |
AETV Revenue ($) |
Basslink Revenue ($) |
|---|---|---|---|---|---|---|---|
| 13:00 | -339 | 27 | 1,169 | 332 | -226,291 | -22,205 | 60,769 |
| 13:30 | -1 | 28 | 1,251 | 424 | -500 | -41 | 5,972 |
| 14:00 | -1 | 32 | 1,123 | 289 | -450 | -45 | 4,719 |
| 14:30 | -669 | 76 | 1,184 | 500 | -511,857 | -41,807 | 186,210 |
| 15:00 | -999 | 188 | 1,260 | 594 | -852,479 | -62,478 | 352,827 |
| 15:30 | -999 | 502 | 1,247 | 594 | -845,676 | -62,478 | 445,990 |
| 16:00 | -35 | 1,413 | 1,252 | 547 | -30,437 | -777 | 396,099 |
| 16:30 | -98 | 3,555 | 1,254 | 543 | -85,650 | -439 | 991,689 |
| 17:00 | -31 | 23 | 1,248 | 546 | -27,272 | -78 | 14,810 |
| 18:00 | -1 | 41 | 1,101 | 0 | -400 | -5 | 0 |
| 18:30 | -1 | 26 | 1,107 | 79 | -428 | -2 | 1,064 |
| Total | 6,598MWh | 2,224MWh | -$2,581,442 | -$190,354 | $2,460,150 |
We can see that Hydro Tasmania made revenues of approximately -$2.47M as a result of generators bidding negative. However, Basslink’s revenues were close to $2.47M from exporting to Victoria during the price spike.
Hydro Tasmania is paid the trading revenues from Basslink (under a financial agreement with the owner of the interconnector). As such, Hydro Tasmania can make a profit by having generators bid negative if the prices in VIC are sufficiently high that the revenues from Basslink can cover generator losses. Negative bids ensure that Basslink is preferentially dispatched in Victoria before local generators that are offering higher prices. As the higher bidding generators must also be dispatched to meet the demand, the price in VIC is set according to these higher bids.
As these numbers above are approximate it is unclear exactly what the outcome was for Hydro Tasmania in this particular situation.
And why did the AETV generators bid negative? We have not found any data to explain this, so are uncertain as to why this was the case.
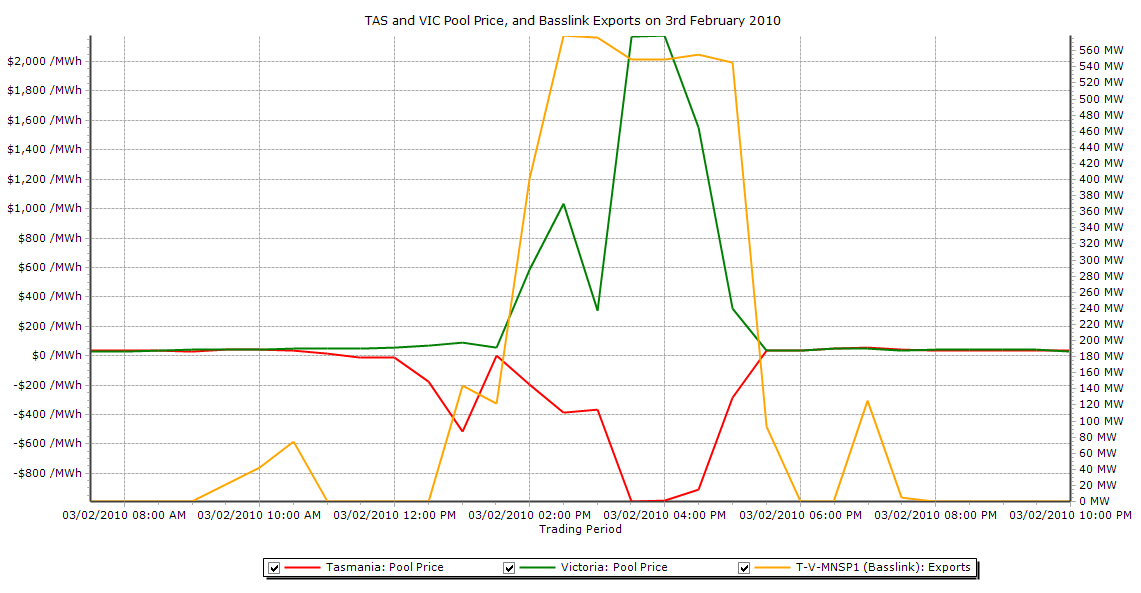
Wednesday 3rd February
The same situation between Tasmania and Victoria, as seen on the 2nd, re-occurred at about the same time on the following day.
| TAS Daily Average Pool Price | -$76 |
| TAS Daily Average Demand | 1,078MW |
| TAS Daily Total Demand | 25,873MWh |
| Hydro Tasmania Daily Total Revenue | -$3,620,574 |
| AETV Power Daily Total Revenue | -$22,524 |
| Basslink Daily Total Revenue | $3,389,928 |
The table below shows the Hydro Tasmania, AETV and Basslink revenues for negative priced dispatch intervals on the 3rd of February.
| Dispatch Interval | TAS Pool Price ($/MWh) |
VIC Pool Price ($/MWh) |
TAS Demand (MW) |
Basslink Exports (MW) |
Hydro Revenue ($) |
AETV Revenue ($) |
Basslink Revenue ($) |
|---|---|---|---|---|---|---|---|
| 11:30 | -10 | 51 | 1091 | 0 | -4192 | -605 | 0 |
| 12:00 | -10 | 57 | 1088 | 0 | -4407 | -605 | 0 |
| 12:30 | -175 | 68 | 1089 | 0 | -78394 | -10918 | 0 |
| 13:00 | -517 | 90 | 1154 | 144 | -293960 | -32289 | 43681 |
| 14:00 | -196 | 587 | 1214 | 401 | -142312 | -12229 | 157010 |
| 14:30 | -383 | 1034 | 1229 | 579 | -317644 | -23936 | 410166 |
| 15:00 | -362 | 306 | 1221 | 577 | -316052 | -4711 | 192805 |
| 15:30 | -991 | 2170 | 1242 | 549 | -872676 | 0 | 867791 |
| 16:00 | -985 | 2177 | 1261 | 549 | -876870 | 0 | 867977 |
| 16:30 | -906 | 1552 | 1271 | 555 | -813788 | 0 | 682273 |
| 17:00 | -284 | 319 | 1293 | 546 | -256467 | 0 | 164600 |
| Total | 6,577MWh | 1,950MWh | -$3,976,762 | -$85,294 | $3,386,302 |
Again, Hydro Tasmania generators totalled negative revenues in the millions (this time close to $4M) during the half hours where the pool price was negative, and Basslink made positive revenues in the same order of magnitude.
It is also worth nothing that there was a spike in the Raise 6 second FCAS price in Tasmania on both days (for 1/2 hour each) that will have impacted on revenue positions, although the spikes were not coincident with the negative prices, and would not have made too much difference to revenues.


Be the first to comment on "Investigation of Negative Prices in Tasmania on 2nd & 3rd February"