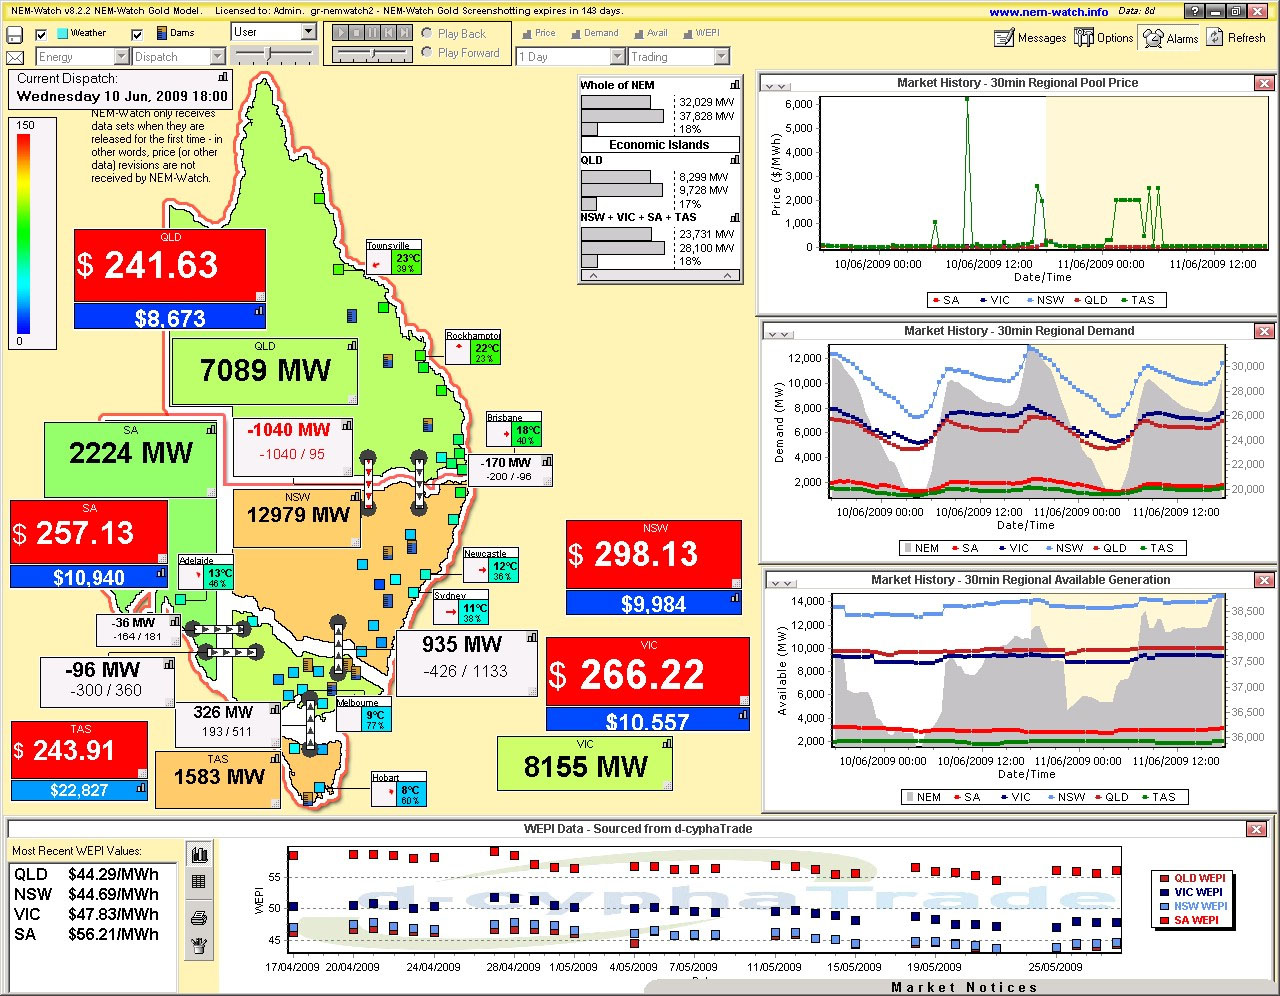
The following snapshot from NEM-Watch v8 (captured automatically through a Local Alarm we have set up on a display machine in our office) highlights how demand rose above 32,000MW for the first time this winter (to 32,029MW at 18:00).
In particular from this diagram, see (by the relative colour-coding) how the demand in both the NSW and Tasmanian regions was relatively high, compared with the all-time maximums for these regions.
Paul was one of the founders of Global-Roam in February 2000. He is currently the CEO of the company and the principal author of WattClarity. Writing for WattClarity has become a natural extension of his work in understanding the electricity market, enabling him to lead the team in developing better software for clients.
Before co-founding the company, Paul worked as a Mechanical Engineer for the Queensland Electricity Commission in the early 1990s. He also gained international experience in Japan, the United States, Canada, the UK, and Argentina as part of his ES Cornwall Memorial Scholarship.
Our guest author, Rob Davis, provides insights on how weather patterns are contributing to electricity consumption this winter – particularly in Victoria.
Just after midday today (Wednesday 21st April) South Australia and Victoria experienced some high spot prices. Here’s a quick post to highlight what happened.
Be the first to commenton "First Spike in Demand this Winter As Temperatures Plunge"

Be the first to comment on "First Spike in Demand this Winter As Temperatures Plunge"