1) Why we’ve put this together
For those who weren’t aware, Winter 2009 has seen us offer our “Who’s the Best Demand Forecaster in the NEM” challenge – as a chance for the market to redeem itself, following what happened in summer 2008-09 (when the market surprised us all).
Of particular interest, this winter we’re offering your choice of whiz-bang Espresso Coffee Machines as an incentive.
2) Why a “Cheat Sheet”?
Since 2000, our business has grown to the stage where we serve hundreds around the country (and internationally) who have some involvement in (or at least an interest in) Australia’s National Electricity Market (NEM).
In particular, we provide software to:
- most of the wholesale market participants (the generators, traders and retailers – who, you would expect, would have a good shot at nailing this answer) and
- a wide range of market observers (some of whom would freely admit that they are not “NEM experts”).
To even up the playing field, a little, we’ve included this analysis of the levels of demand achieved in recent summers.
3) Growth in Peak Demand
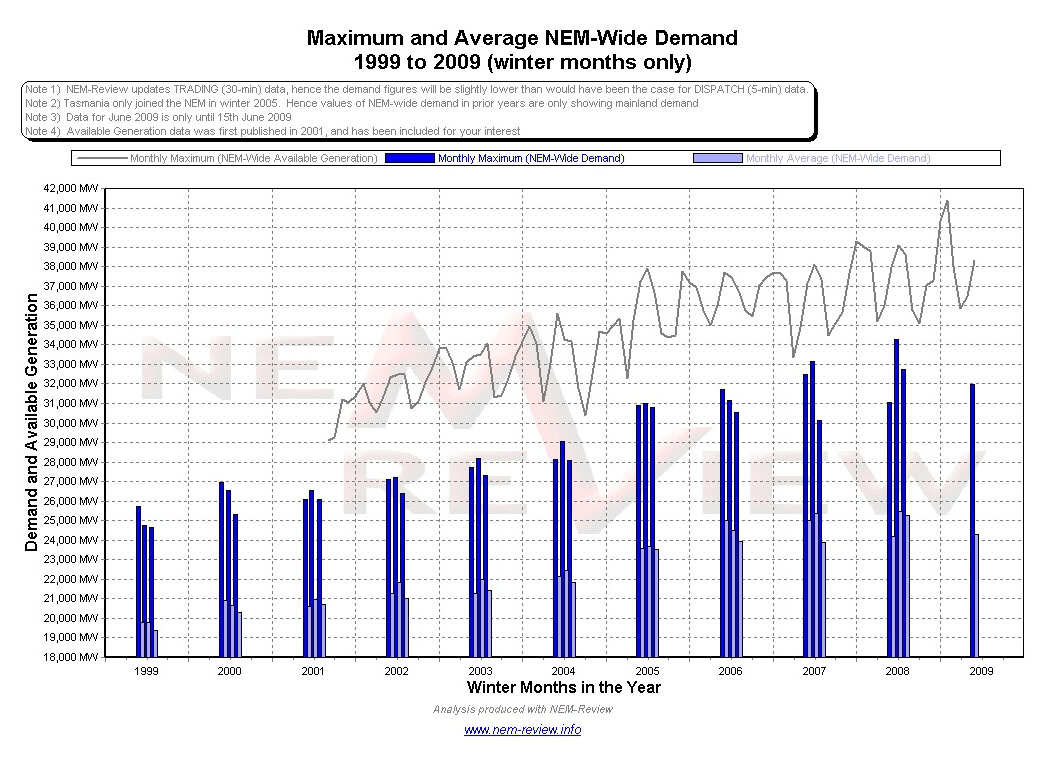
The following chart (produced with our NEM-Review software) illustrates how peak and average demand has grown, each winter, since the NEM started at the end of 1998.
We hope that this will give you something to aim for, in submitting your bids.
Of course, we have also previously prepared a number of articles covering various events that have characterised winter months in previous years. These articles can be accessed through the following summaries:
- A summary of the month of June over 10 years of NEM history (1999-2008);
- A summary of the month of July over 10 years of NEM history (1999-2008);
- A summary of the month of August over 10 years of NEM history (1999-2008).


Be the first to comment on "A review of recent winters in the NEM"