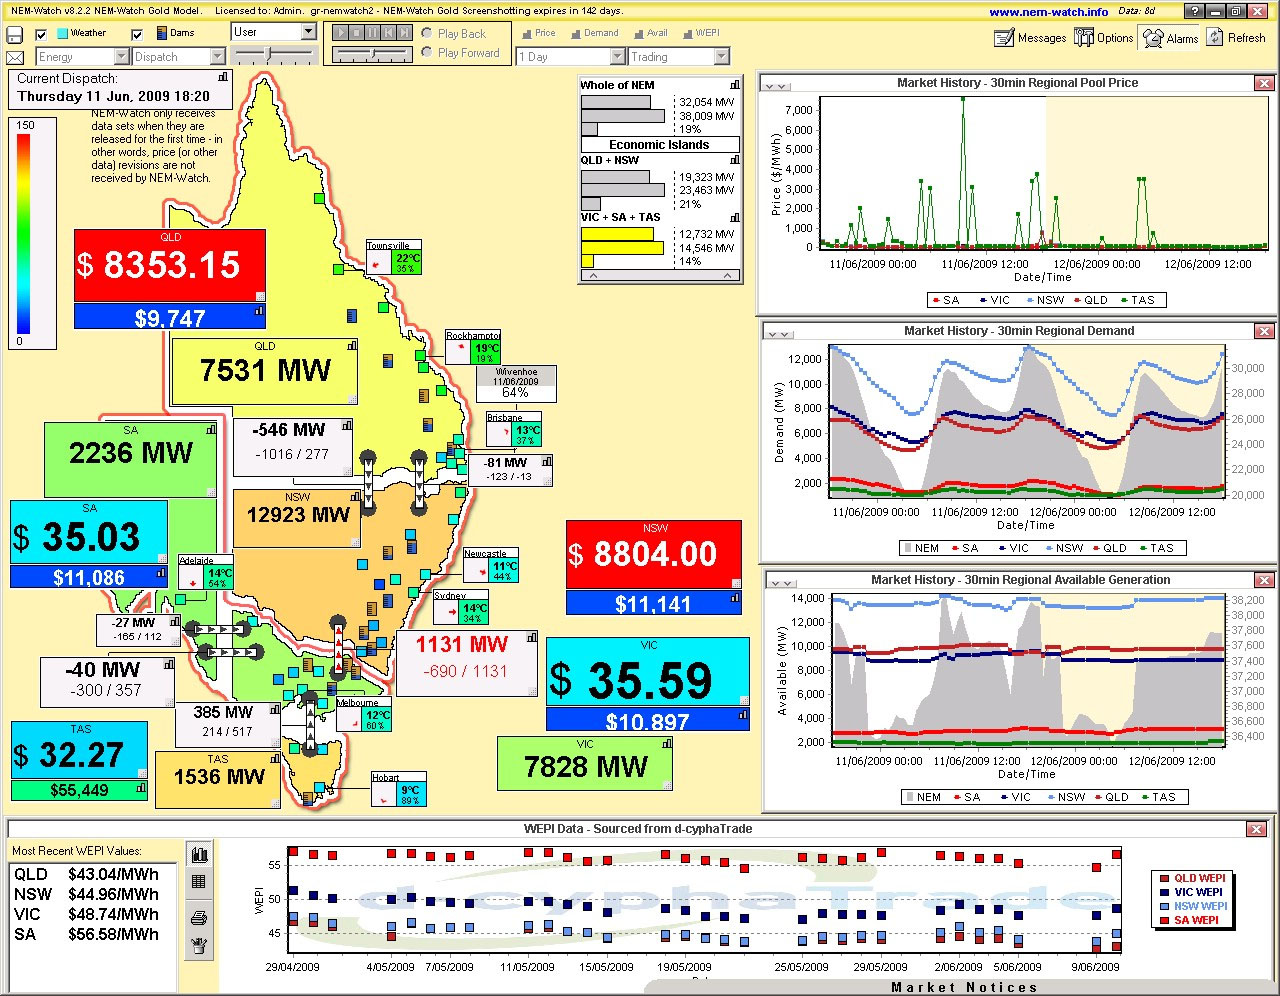
We noted yesterday (Wednesday 10th June) that NEM-wide demand climbed past 32,000MW for the first time this winter.
The following evening saw demand climb to similar levels (a peak of 32,054MW at 18:20 – so 35MW higher than the previous night). However the situation on Thursday night was different in two key ways:
1) Firstly, we see in this snapshot from NEM-watch that the temperature across QLD were much lower in QLD compared to the previous evening (Brisbane shows a temperature of 13°C compared to the previous evening 18°C, albeit ), which resulted in the demand for QLD being considerably higher (7,531MW compared with 7,089MW).
click to view full size

In contrast, the temperature in Melbourne was warmer than the previous evening – hence VIC demand lower by 327MW. The colour coding of the regions makes these demand changes more obvious.
2) What’s also noticeable is that the prices in QLD and NSW have spiked – especially in relation to the prices in the southern regions.
What’s particularly interesting is that this has happened despite the fact that the “Economic Island” of VIC+SA+TAS having a relatively smaller percentage of spare capacity – indeed, low enough (14%) to trigger the yellow warning level in the IRPM indicator of the display.
If all else was equal, one could expect that prices would be higher in the regions where spare capacity margin is lower – however the above shows that the inverse was true on this occasion. As can be seen from the above, prices in QLD and NSW were approaching VOLL despite the fact that there was 4,140MW of spare capacity available to the market (in QLD and NSW) but not needed to meet the demand.


Be the first to comment on "Prices Surge in QLD and NSW as Demand Climbs"