Following from Wednesday’s blackout (and my late-night initial animation here) I’ve seen plenty of pictures of downed transmission lines on Twitter and elsewhere.
Not having time to establish copyright limitations I have not included them here, but I am sure you’ve already seen enough!
Clear to say that wind was a major factor, in terms of the downed transmission lines. The more I dig, and speak with people who know more than me, the more other questions I generate… (in terms of both the lead-in contributing factors for the trips, and also in terms of the recovery)
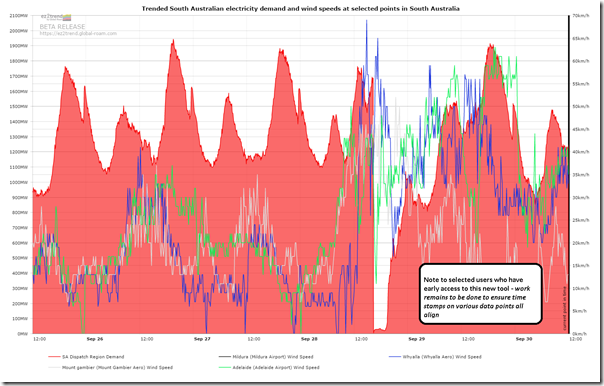
Here’s a quick comparison of wind speeds for selected sites in South Australia and the South Australian electricity demand over the past few days – including the blackout of Wednesday 28th, but also including the storms of last night:
Also a note for those, like me, who are quite pedantic about data – the SA demand trace here is shown in NEM time (Eastern Standard Time, so 1/2 hour ahead of Adelaide time at this time of year) whilst the wind speed data (from the BOM) is, I believe, currently still* shown in local time of measurement. Not that it makes any real difference in a chart of this time scale, but thought I should point it out…
* “still” because ez2trend™ is still under active development.


Electranet claim to design for a windspeed of 41 m/s. That’s 147.6 kph. 70 kph and even 90 kph should be just a breeze to a transmission line 😉
Bear in mind too that doubling the wind speed quadruples the wind pressure.
The 70 km/hr wind speed at Whyalla Airport could well be magnified several fold on the hills that the transmission line crosses. There may also be some harmonics that set up by strong winds on the line.
BOM reported 100+ kph winds at Snowtown
28/03:37pm W 50 104
28/03:34pm WNW 54 104
28/03:30pm WNW 46 104
28/03:28pm NW 35 104
That is windspeed followed by gust.
AFAIK those BOM values are ground level air speeds. What sort of speeds would you expect at 30m above ground (where the towers are)?
From BOM: Sep 28 UPDATE Severe Weather Warning, locally DESTRUCTIVE wind gusts about 130km/h are possible KI, York Pen and Mid North.
So on the face of it, I could believe that the towers were hit by local gusts in excess of design load.
The question is – is a design goal of 41m/s in fact adequate?
Forget about the design wind speed and recorded Met wind speeds when you have localised tornados touching down in the area around those transmission lines-
http://www.adelaidenow.com.au/news/opinion/tory-shepherd-federal-government-using-sa-blackout-to-prod-debate-over-renewable-energy/news-story/fb756bf99f54d7beba2c5212888122e8
I find this quite interesting. I live in Casper, Wyoming, USA. Today we have a high wind warning—meaning approximately 50 to 65 kph sustained winds and gusts to 95 kph. At times, we will have such winds for 2 or 3 days at time. Transmission lines sometimes go down, though usually it takes more than the 95 kph to bring them down. Some towns have had 160 kph wind gusts repeatedly. I realize that the high winds are not usual to South Australia.
Wyoming does have some wind plants, but most of our power comes from coal plants. The wind turbines often shut down due to the high winds, but no one seems to notice. I have to tell people to watch and see that the turbines don’t turn. I’ve seen them shut down in wind—turning one minute, still the next. People just don’t understand how wind turbines work and how variable and limited the output is.
Remember too that at higher windspeed the wind turbines will shut down ( and are braked) to prevent damage.