

The machinations of what happened yesterday evening (Wednesday 8th July 2026) in the southern regions has attracted some interest, and discussion.
We have already posted a couple articles, but wanted to advance the conversation with this one – in which we highlighted four factors that combined to contribute to the volatile outcomes in VIC, SA and TAS.
1) These are in no particular order … certainly don’t read these in terms of decreasing or increasing relative significance!
2) But please note, dear reader, that we’re already aware of several additional factors – but don’t have the time (or inclination?) to share some more freely here
3) First and foremost, remember that ‘the NEM’s a complex place!’
Factor #1) Unexpected coal scarcity
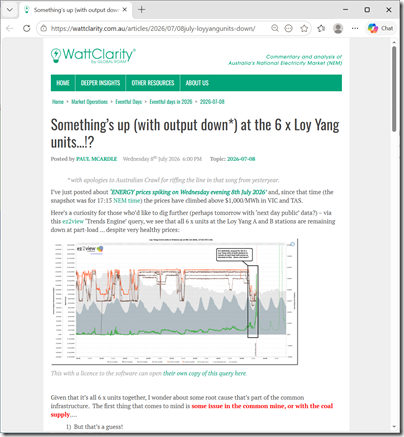
We’ve already written twice about this … yesterday (as it was unfolding) we shared ‘Something’s up (with output down*) at the 6 x Loy Yang units…!?’:
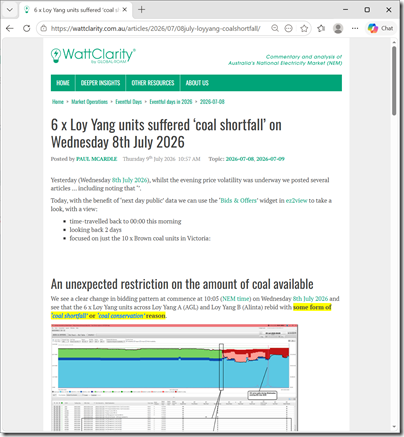
Then earlier today, with ‘next day public’ data, we shared more via ‘6 x Loy Yang units suffered ‘coal shortfall’ on Wednesday 8th July 2026’.
Factor #2) Restrictions on imports from NSW
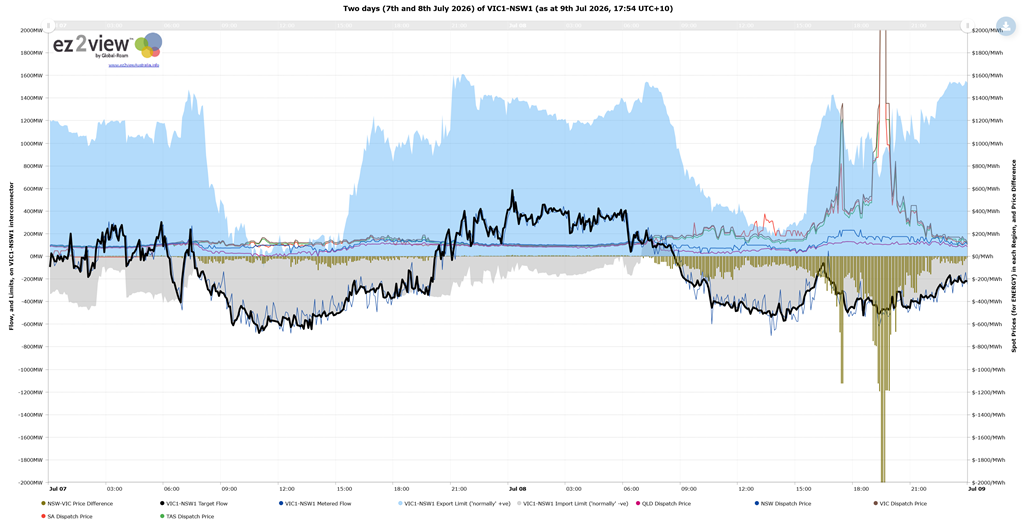
Reminding readers what an inter-regional interconnector represents, we then take a look at the VIC1-NSW1 interconnector via this ‘Trends Engine’ chart from ez2view:
Those with a licence to the software can open their own copy of this query here.
For those unaware, often the peak daily ‘import limit’ (i.e. representing flow from NSW into VIC) might be as large as –1,000MW (negative number representing flow south) and at rarer times has approached twice that.
So we see:
1) that the transfer limit southwards was quite restricted through the entire 48 hour period.
2) that price separation between NSW and VIC occurred through many hours over the two days (i.e. when the Target Flow was running at the Import Limit)
3) but:
(a) was particularly pronounced through the volatile period on Wednesday 8th July 2026
(b) without the flow limit being notably more constrained than at other times during the two day period when the pricing did not ‘pop’.
(c) but still flows constrained south.
Don’t have time to explain (and apologies for being cryptic for those not so familiar), but flagging for future reference purposes that the ‘N-DTSS_11’ constraint set was a factor in a number of these intervals
… we’ve come across that one before, and others like it.
Factor #3) Very limited VRE
Here’s two snapshot from ‘Bids & Offers’ widget in ez2view focused on the VRE Fleet across VIC+SA+TAS. We’ll start with solar (noting that there are not yet any Large Solar farms operational in TAS):
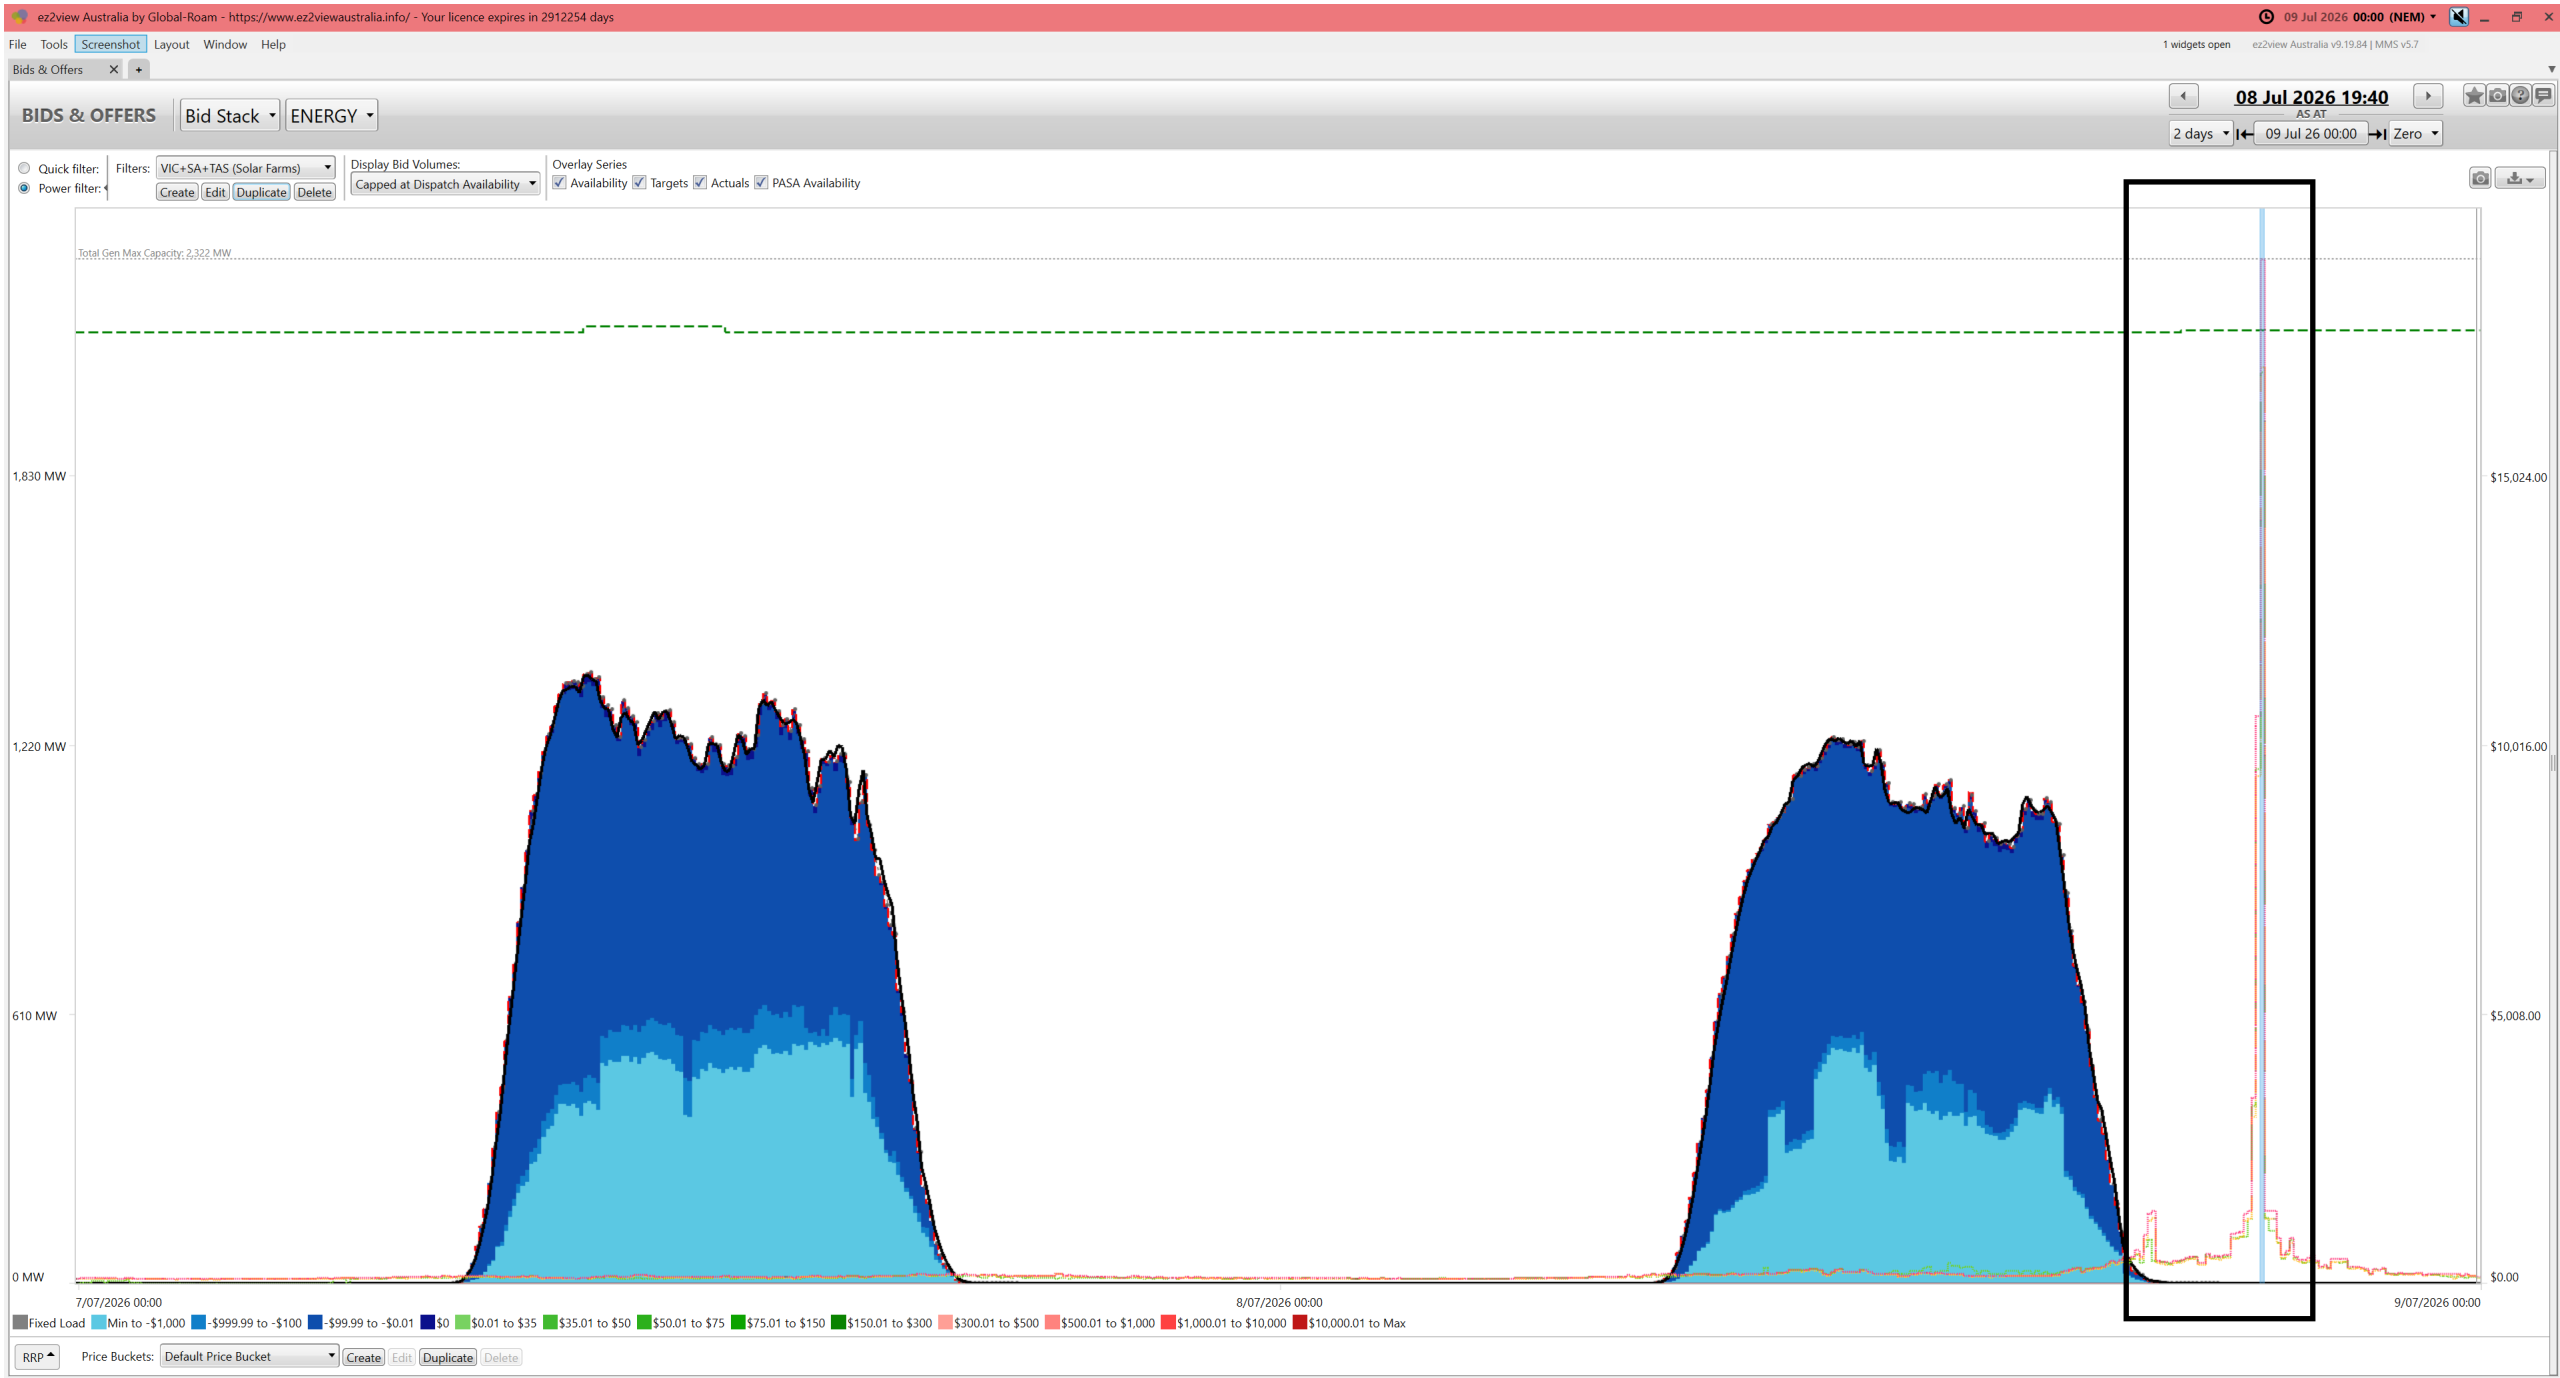
Obviously very much an ‘after dark’ phenomenon. Here’s Wind, to complete the ‘dunkelflaute’ quinella:
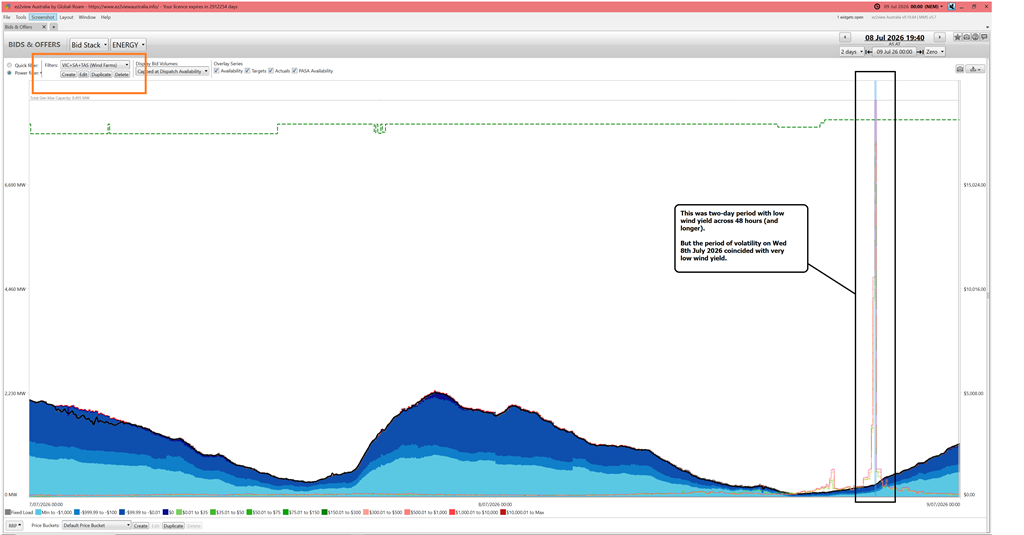
In terms of specific numbers:
1) There was 8,495MW of installed capacity
(a) noting that some of this is not yet fully operational, so you could
(b) and remembering these complexities in measuring installed capacity.
2) From this fleet, at the time of peak volatility, the aggregate availability was ~260MW
3) Which means an availability factor of ~3%
Factor #4) Batteries appearing to under-perform (again)
Last but not least, here’s a snapshot from ‘Bids & Offers’ widget in ez2view focused on the battery fleet across VIC and SA (there are currently none in TAS):
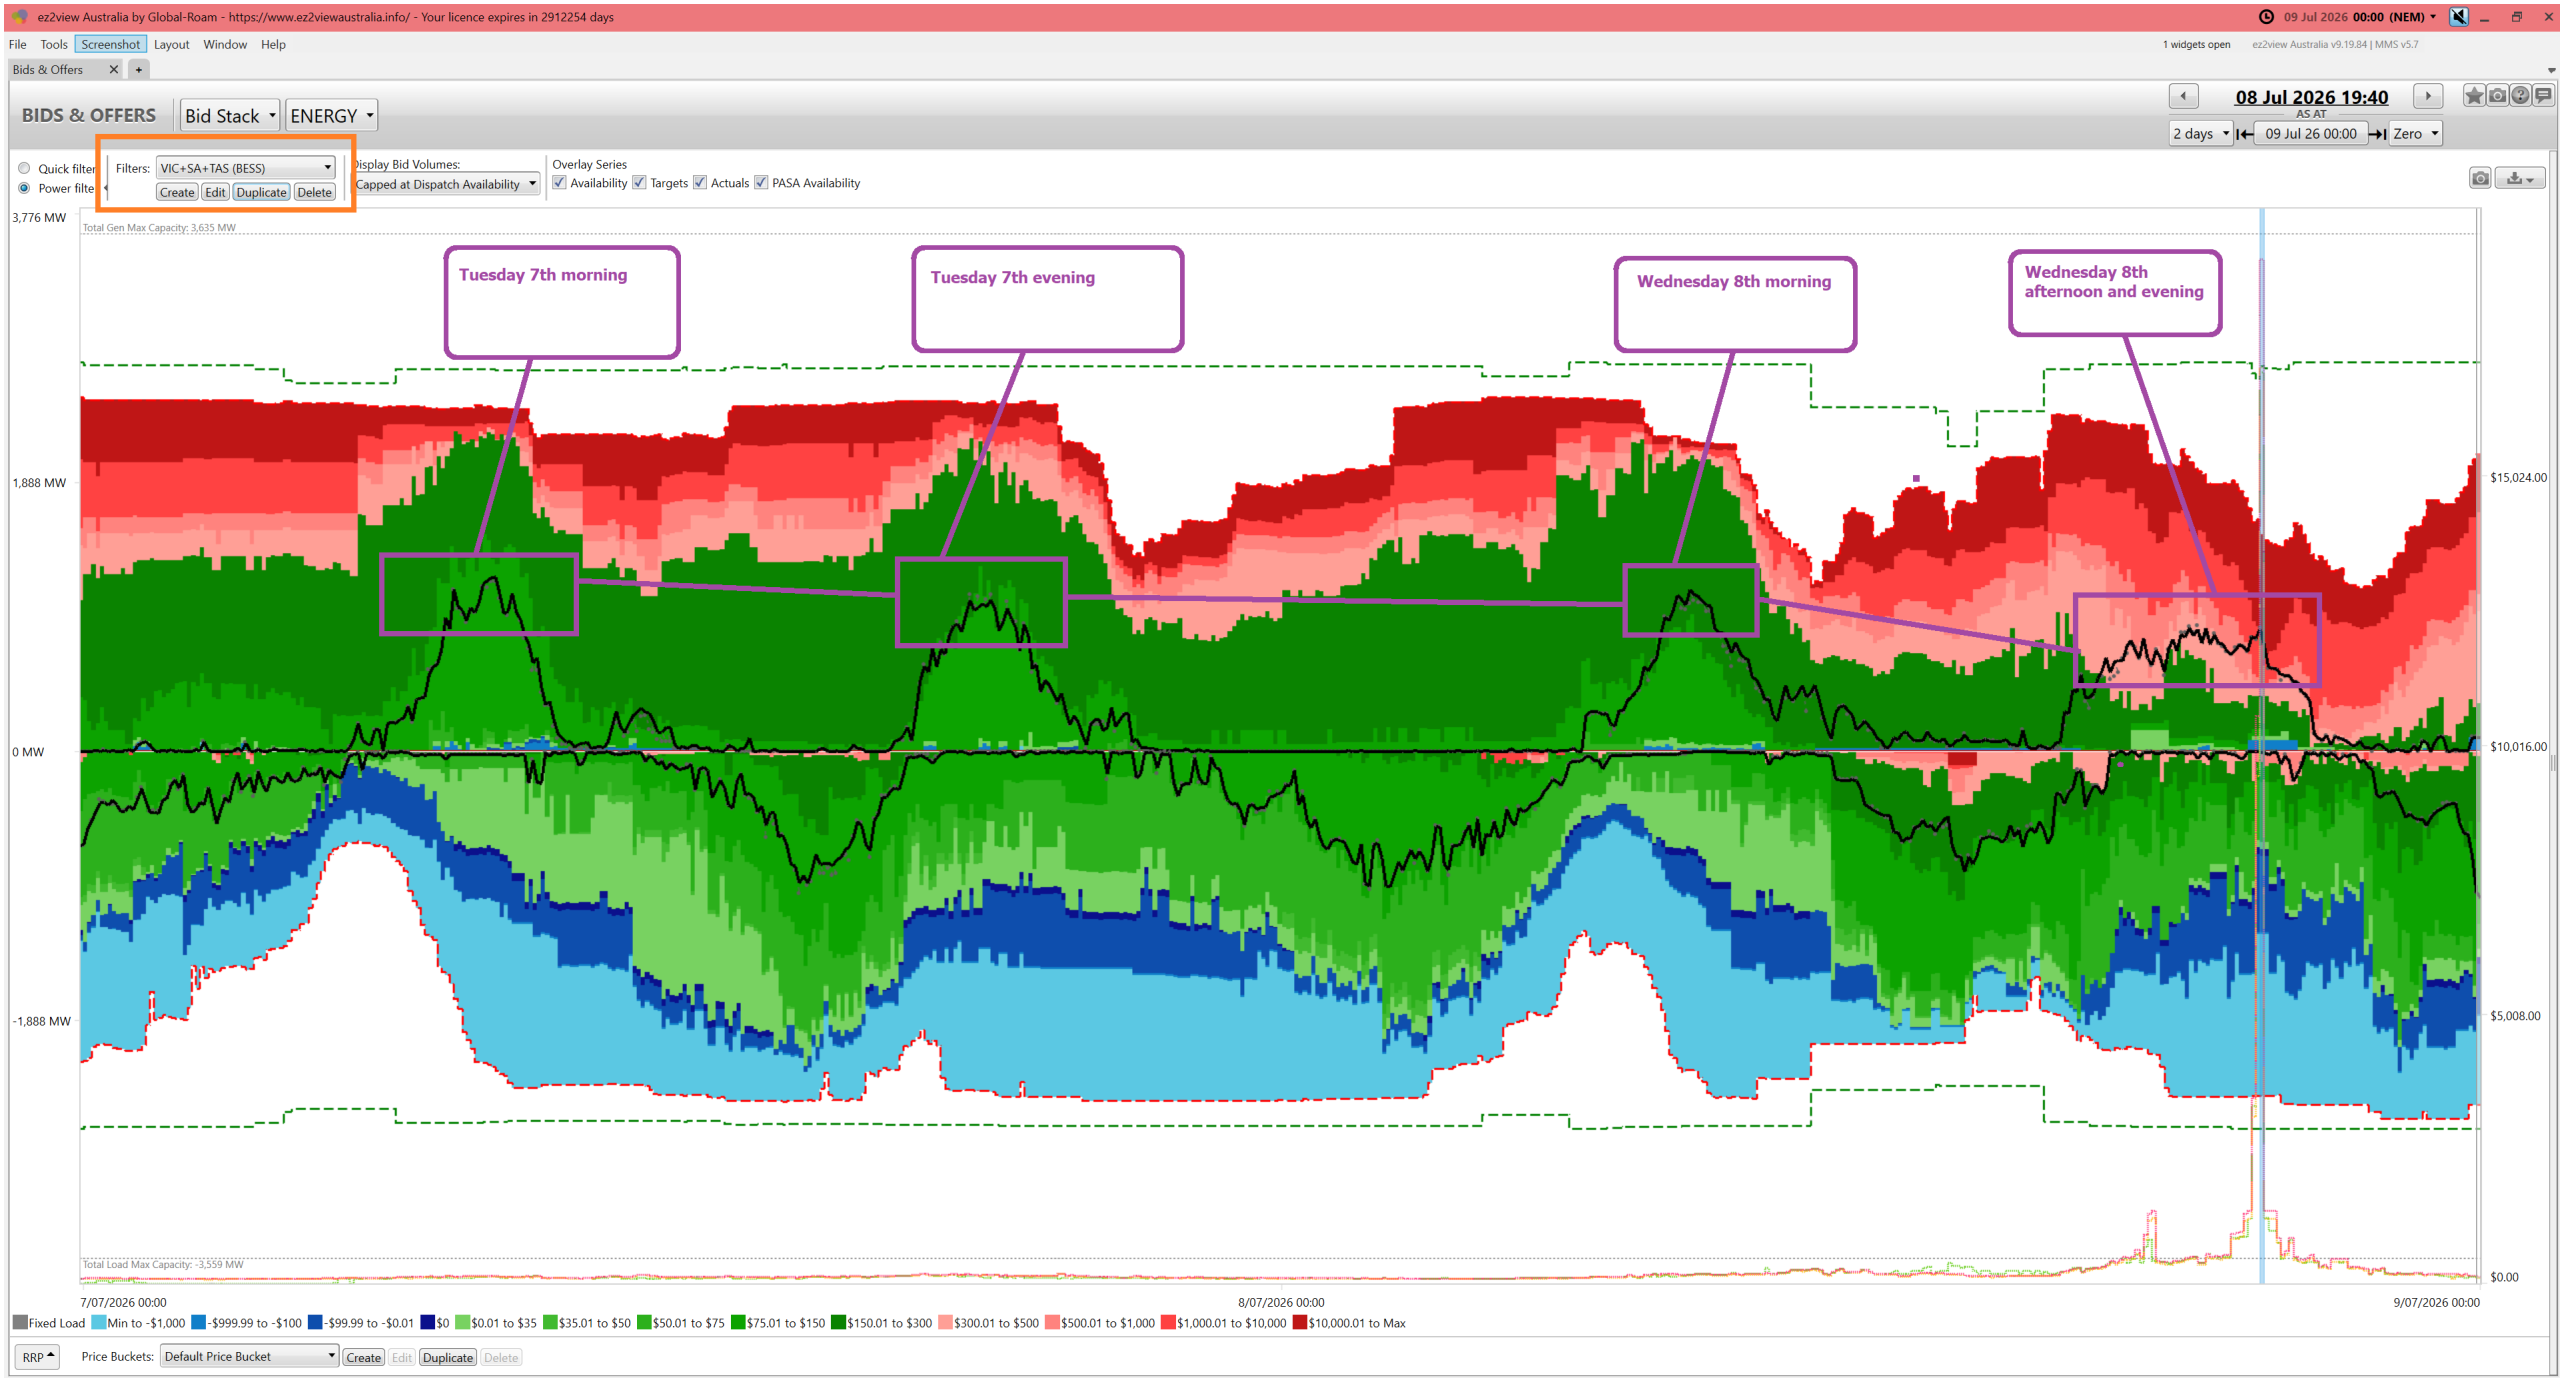
Don’t have time to explain in detail, but note two related things:
1) The lower (and longer) peak discharge on Wednesday evening 8th July 2026 … compared to the morning, or prior Tuesday morning and evening periods 7th July 2026
2) The higher prices offered compared to the three earlier periods of peak output.
Somewhat curious to note:
1) that yesterday’s shortcomings came not long after the underperformance of many of the battery fleet in South Australia late in June for quite similar underlying reasons (i.e. a limited understanding of how dispatch and the market works).
2) but, in judging battery performance (or that of any other assets) it’s important to keep in mind:
(a) what I might flippantly term ‘the Heis-energy-burger Uncertainty Principle’
(b) along with other considerations we won’t go into here.
And that’s where we’ll leave this for now….

Be the first to comment on "Here’s four factors contributing to volatility in VIC+SA+TAS on Wednesday evening 8th July 2026"