We’ve just noted this ‘A second look at the frequency drop on Friday afternoon 31st October 2025’, and so know that the lowest point being at 49.841Hz at 13:55:28.1 (which was outside of the Normal Operating Frequency Band, and so presumably triggered some Contingency Raise FCAS).
In this article we’ll use the ‘Trends Engine’ in ez2view to take a quick look at ‘Dispatch Error’, which is a calculation that leads into the more complex calculation of ‘Raw Off-Target’ for each (Scheduled and Semi-Scheduled) unit, and which we commonly aggregate up to ‘Aggregate Raw Off-Target’
1) relevant to this discussion is the recent article ‘Comparing AggROT for (44x) Coal Units with AggROT for Semi-Scheduled units through the history of the NEM’, and those linked within it.
2) and the clear escalation/acceleration seen in large collective under-performance across Semi-Scheduled VRE units in recent years.
But lets now focus on this particular incident.
Through the day
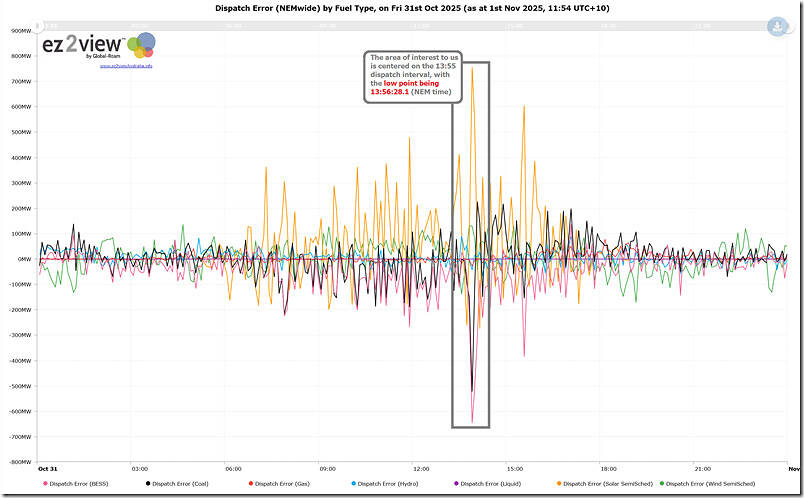
Using a query we’ve used in several recent articles, here’s a trend through the day:
Briefly note that:
1) All units may have a Dispatch Error, and it may be positive (under-performance) or negative (over-performance);
2) It’s whether this deviation from Target is helpful or unhelpful that is of most interest.
The chart above is for the whole day, so let’s zoom into the area highlighted, containing the ~5 x Dispatch Intervals of most interest.
Focused on the ~half hour in question
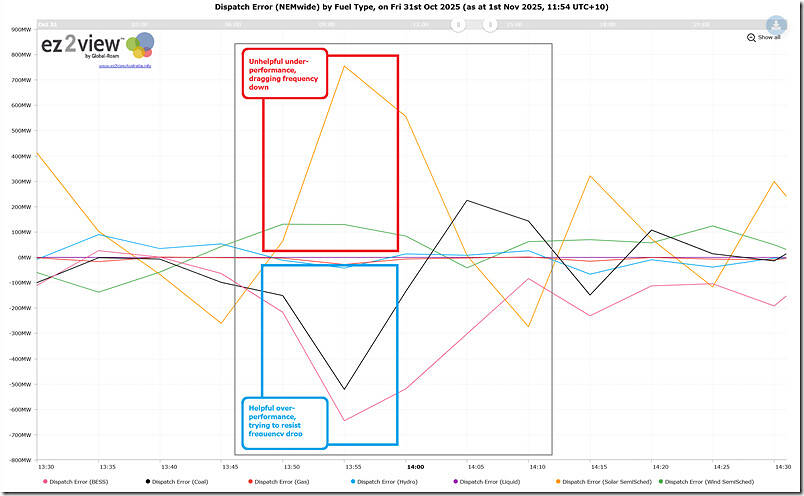
In the chart below we have zoomed into a time range of about an hour, with particular focus on the 13:55 dispatch interval (NEM time):
- Which is just prior to the lowest point of frequency, and hence ;
- Where positive Dispatch Error (i.e. under-performance relative to Target), will have been harmful to frequency; whilst
- Negative Dispatch Error will have been helpful.
In this chart we can see that (at the 13:55 dispatch interval):
1) The Semi-Scheduled units were collectively dragging frequency down:
(a) This was particularly bad for the collective Large Solar Farm fleet:
i. With an Aggregate Dispatch Error = +755 MW.
ii. Which will be interesting to see by unit to understand if weather patterns were the cause;
(b) With Wind also having a positive Aggregate Dispatch Error (+130MW)
2) Of the Scheduled units:
(a) Both coal (-521MW) and BESS (-645MW) units collectively performed with negative Aggregate Dispatch Error, to boost the frequency;
(b) This is a common pattern we are seeing in this analysis.
So that’s where we’ll leave this analysis, for now…


Leave a comment