On Sunday (following from the discussion at the NEMdev conference in Brisbane a few weeks ago, and leading into this week’s All Energy 2025 in Melbourne) I highlighted these ‘Two *big concerns* that we urge the Nelson Review panel to (re)consider (with respect to Invisible Responses) following review of the Draft Report’.
So with this article we’ll focus on what we labelled here as Concern #2.
1) We called these concerns ‘the elephant in the room’ … given that the draft Report is silent on these concerns)
2) To us, we’ve been increasingly aware of some rapidly escalating challenges with respect to the rise of Semi-Scheduled resources
3) To illustrate, we’ll use a longitudinal comparison of two similar metrics to illustrate the speed at which concerns should be increasing (even if some are still not as aware as we believe they should be). We’ll compare:
(a) Aggregate Raw Off-Target (AggROT) through >20 years for the 44 remaining coal units; with
(b) Aggregate Raw Off-Target (AggROT) through ~10 years for the growing fleet of Semi-Scheduled units …
i. i.e. across an ever escalating number of units
> both wind and solar together
> increasingly spread geographically far and wide
ii. partly to explore the commonly touted hypothesis that could be paraphrased as ‘diversity is a magic wand’.
A refresher on the calculation of Aggregate Raw Off-Target
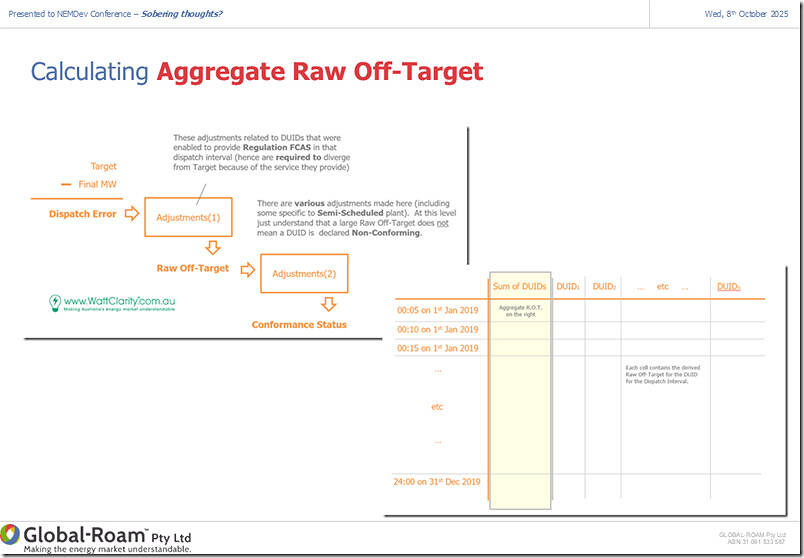
Let’s start by a refresher of the calculation of Aggregate Raw Off-Target (AggROT), and what that metric represents. During NEMdev 2025, I presented this slide to summarise:
As we see:
1) This calculation builds on the calculation for ‘Dispatch Error’
(a) With the directionality of both such that:
i. Under-performance is represented in positive Aggregate Raw Off-Target (and Dispatch Error)
ii. Whereas over-performance is represented in negative Aggregate Raw Off-Target (and Dispatch Error)
(b) Note that this is also a feed-through to the AEMO’s own processes for managing unit Conformance Status.
2) For both cohorts of units, we just aggregate the individual Raw Off-Target metric across the whole of the cohort for each Dispatch Interval … so we have ~105,000 results for each calendar year:
(a) For the coal units, we’re deliberately using just the 44 x still-operational units in order to be able to assess (and illustrate) how the relative performance across these units has changed over time.
(b) For the Semi-Scheduled units we are comparing the metric across the (growing, and increasingly diverse) asset base, in order to point to emerging challenges that are fast coming down the pipe
Trending (a count of) ‘large’ instances for each calendar year
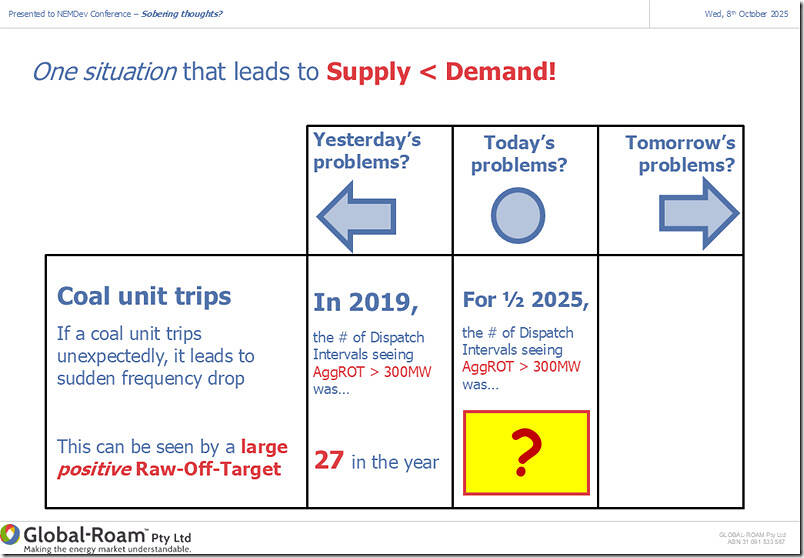
There’s always a choice as to a threshold beyond which is considered ‘large’. For my presentation at NEMdev 2025, I’d chosen a threshold of 300MW and had challenged the audience to guess how the trend had changed for the first half of 2025:
For this article, however, I’ve done two things:
1) Firstly, I’ve updated the analysis (for both cohorts of units) in order to extend through 2025 Q3 to the end of 30th September 2025;
2) And I’ve also chosen 500MW as a different threshold – to focus on the larger exceedances….
A trend of the incidence of large collective under-performance (i.e. AggROT > +500MW)
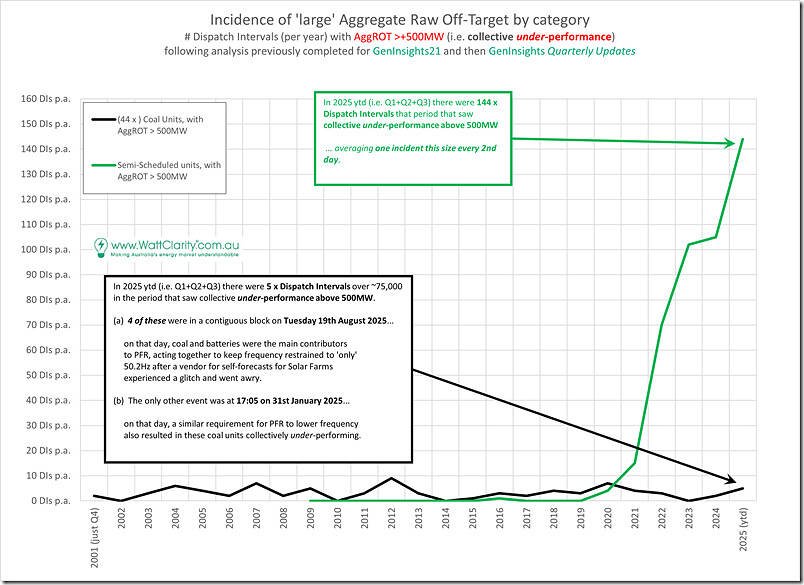
Firstly, let’s start with the trend where the pattern is so starkly different between the two cohorts of units:
It’s clear to see that:
1) There’s a clear difference between both trends:
(a) Whilst collective under-performance across the coal cohort has remained quite consistent over more than 20 years,
(b) There’s been a rapid escalation in collective under-performance across the Semi-Scheduled fleet;
2) Specifically, with respect to the Semi-Scheduled fleet:
(a) This climb (at the 500MW exceedance level) began in 2021 but accelerated in 2022
(b) There was a pause from 2023 to 2024 (for reasons that have not been explored at this point)
(c) But 2025 ytd shows the growth has returned, even just over the first 9 months of the year.
… for those who have been following articles categorised here as trended AggROT for Semi-Scheduled units, this won’t be a surprise.
A trend of the incidence of large collective over-performance (i.e. AggROT < -500MW)
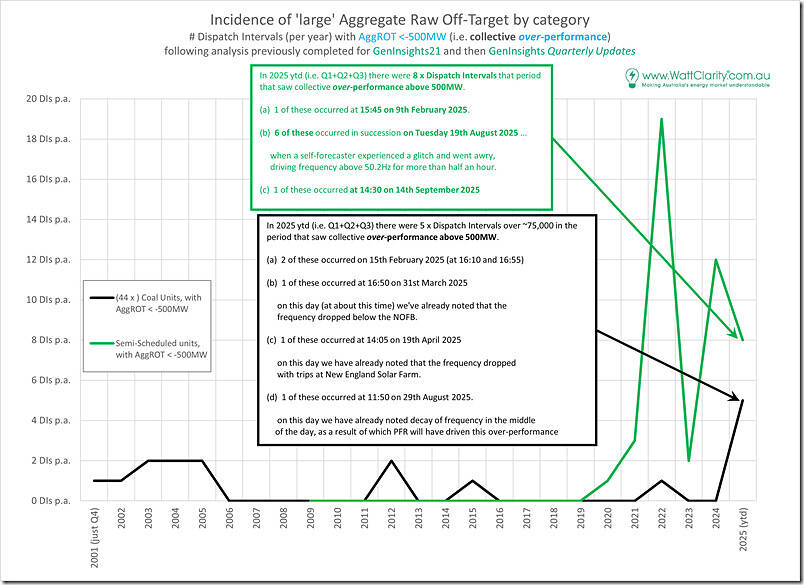
Now notice the clearly different pattern for large collective over-performance:
Whilst there has been an uptick for Semi-Scheduled units since 2021, the scale of the numbers is an order of magnitude smaller.
Tabulating the incidents in 2025 noted above
In the following table, we’ll briefly explore each of the incidents noted in the two trends above …
| Dispatch Interval | Coal Units | Semi-Scheduled Units |
|---|---|---|
| 17:05 |
We noted in the chart above that the 17:05 dispatch interval saw a large collective under-performance across the 44 x coal-fired units at that time. At that time, AggROT = +508MW. Readers should note the shortly after the event ‘Last Friday’s large and (mysterious) apparent drop in NSW ‘Market Demand’ (part 3) … what helped restrain frequency?’. This illustrates that the collective underperformance across the coal units (and presumably across BESS and others as well) was beneficial to restraining ballooning frequency. |
At this time, AggROT = –62MW (i.e. mildly over-performing, so acting to push frequency higher at a time when it did not need to be). |
| 15:45 |
I’ve not looked at AggROT for coal units at this time. |
At this time, AggROT = –600MW (i.e. over-performing). There were no articles published with respect to this day (yet), so we don’t immediately know what the state of the frequency was.
|
| 16:10 and 16:55 | On the 15th February 2025, there were two instances of ‘large’ over-performance across the 44 x coal units:
These have not been investigated further, at this point. |
For the same dispatch intervals on this day, there were two instances of large under-performance across the Semi-Scheduled units:
So the suspicion is that these under-performances dragged frequency down, and the responses of the coal units (via FCAS and PFR) was aimed to redress this imbalance. In total there were 6 x Dispatch Intervals with AggROT > +500MW through the afternoon, so it might be worth delving more into at some point. |
| 16:50 |
Our hypothesis is that the large collective over-performance of the coal units here (AggROT = –532MW) was to help redress the frequency imbalance caused by the under-performance of VRE. |
We had already noted ‘Frequency excursion on Monday 31st March 2025’ as it happened – but had not explored further this frequency drop. There were 12 dispatch intervals through the afternoon with large collective under-performance of Semi-Scheduled units. The largest of these (at 16:50) was AggROT = +851MW. |
| 14:05 |
Our hypothesis is that the large collective over-performance of the coal units here (AggROT = –503MW) was to help redress the frequency imbalance caused by the under-performance of VRE.
|
We already noted the ‘Drop in NEM Mainland Frequency appearing to coincide with trips at New England Solar Farm, on Saturday 19th April 2025’ when it happened. At 14:05 the AggROT = +834MW (i.e. considerably larger than the loss of the two New England Solar Farm units). There was also a large collective under-performance at 14:20. |
| 6 x DIs |
In response to the VRE induced frequency spike, coal units collectively delivered 4 x dispatch intervals of large under-performance:
These would have been as a result of FCAS and PFR acting to try to restrain the frequency excursion. |
We’ve already written several articles about the large and sustained frequency spike (above 50.2Hz) that resulted on Tuesday 19th August 2025 when self-forecasts from one particular vendor went awry. Worth calling out that the peak over-performance was AggROT = –1,678MW at 12:00, and that there were 3 other dispatch intervals also larger than 1,000MW over-performance. No wonder the frequency was sustained high! |
| 14:30 |
I’ve not looked at AggROT for coal units at this time.
|
At this time, AggROT = –616MW (i.e. over-performing). There were no articles published with respect to this day (yet), so we don’t immediately know what the state of the frequency was.
|
What are the three key differences between Semi-Scheduled and Coal units?
To wrap up, let’s briefly sum up (what I see are) the three key differences between these cohorts ….
| Difference | Explanation |
|---|---|
| Difference #1
Resource intermittency |
Obviously we start with the source of the energy. |
| Difference #2
the difference between Semi-Scheduled and (fully) Scheduled |
As flagged in this ‘two big concerns’ article, it seems to me that the Nelson Review Panel have equated the Semi-Scheduled and (fully) Scheduled as being more similar than they actually are, from a predictability of a response. Whereas readers here will be aware that we’ve been asking ‘is the Semi-Scheduled category scalable and sustainable?’ for a number of years. These questions:
|
| Difference #3
Frequency Control … via Regulation FCAS and PFR |
In various Case Studies we’ve prepared for large AggROT instances for Semi-Scheduled units, it’s become increasingly apparent that the two cohorts behave quite differently in the case of some disruption: 1) In cases where there is some trip of a coal unit (or even rarer coincident trips), the rest of the coal units play a role (via Regulation FCAS and PFR) in acting the redress the imbalance 2) Whereas for the the Semi-Scheduled category, the collective under-performance instances seems to occur when many units together under-perform, but also when there’s not an equal-and-opposite response from other Semi-Scheduled units (despite the promises of diversity) to compensate. |
And that’s where we’ll leave this article today …


Leave a comment