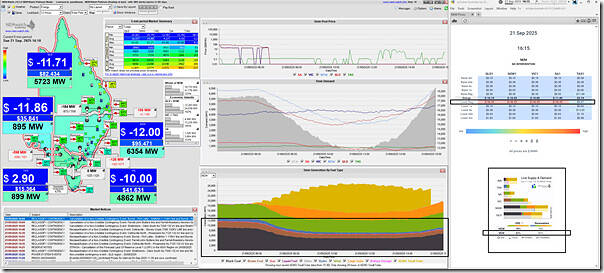
A quick article on Sunday 21st September 2025 with a collage snapshot of three different widgets as follows:
From left to right (and top to bottom) we have:
1) a snapshot from NEMwatch at the 16:10 dispatch interval (NEM time) showing a large share of supply coming from Semi-Scheduled, Non-Scheduled and (partly) invisible VRE
… which leaves Scheduled units running down near minimum load (so with difficulties on adjusting supply at this point)
2) a snapshot of the ‘NEM Prices’ widget in ez2view
(a) which we have included to highlight all 55 spot prices (i.e. for ENERGY and all 10 x FCAS commodities)
(b) and in particular highlighting elevated prices for Regulation Lower FCAS on the mainland
(c) Which is presumably elevated precisely because of the lack of suppliers for the service
3) I’ve also included a snapshot of the RenewEconomy-sponsored NEMwatch widget, to show the percentage level of VRE (note this reason why it’s important) in the NEM.
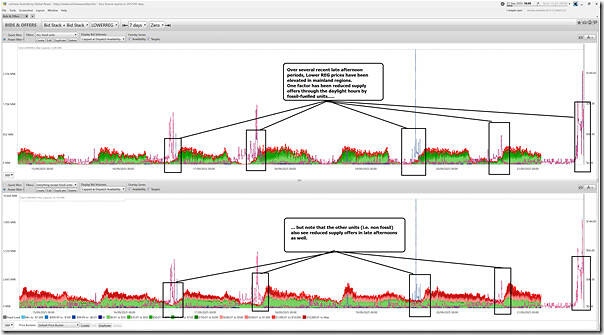
We can’t yet see bids for the current day, but including this snapshot from ez2view at the 16:45 dispatch interval with the ‘Bids & Offers’ widget showing two versions of the ‘Bid Stack’ trend highlights some important background:
We can see that supply offers reduce both:
1) across the fossil-fuelled plant during daylight hours (i.e. when running down towards minimum load, or offline entirely) …
2) but also across the ‘everything else’ category (including hydro, BESS and others)
Nothing further, at this point.


Be the first to comment on "Prices for Lower Regulation FCAS elevated across the mainland Sunday afternoon 21st September 2025"