We’ve already written four different articles pertaining to the frequency spike on Tuesday 19th August 2025 as follows:
1) Soon after it happened, Linton noted the ‘Mainland Frequency Spikes to 50.2 on Tue 19th August 2025’.
2) Before wrapping for the day, and without the benefit of ‘next day public’ data sets, Linton also explored this ‘High level view of some contributing factors to 19 August frequency spike’;
3) The following day (Wed 20th Aug) Linton was above to follow with the 3rd article:
(a) about ‘Unit deviations from target on Tuesday 19th August 2025’.
(b) utilising the ‘next day public’ dispatch interval level data.
… we followed this post with some discussion starters on social media in various places, including:
i. Here on LinkedIn (noting that – at the time of posting this – some discussion has already followed there, independent from us), and
ii. Here on Twitter, and
iii. Here on BlueSky.
4) Then on the weekend, I’d written ‘Three broader questions (re)triggered by the Frequency Spike on Tuesday 19th August 2025’ …
… which was a segue into some longitudinal analysis (in charts and then in a table) with respect to Aggregate Raw Off-Target for Semi-Scheduled units from 1st January 2024 to 30th June 2025.
So in this 5th article, I wanted to peel the onion a little further, and present three charts below – compiled in Excel with data extracted from NEMreview v7 (or can also be done in the ‘Trends Engine’ within ez2view):
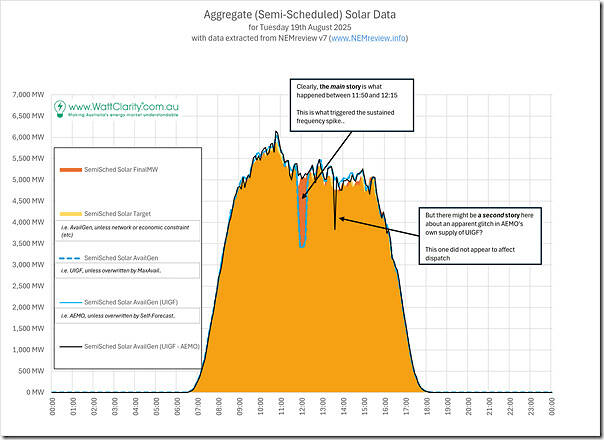
Chart 1 = a summary of the situation, from a Solar Farm perspective
Let’s start with a high-level summary of what happened across the fleet of (currently 106) Semi-Scheduled Solar Farm units across the 288 x dispatch intervals across the day on Tuesday 19th August 2025:
With respect to this image, worth highlighting a few things:
1) In terms of the legend, there are 5 different data series shown:
(a) With reference to these, suggested pre-reading is Linton’s article ‘What inputs and processes determine a semi-scheduled unit’s availability’.
(b) This will help explain how (starting from the bottom and heading to the top) we can understand the progression:
i. Through (3 different) measures of ‘availability’
ii. Then into a Target;
iii. Then finally ‘FinalMW’ (which you might refer to as ‘end of interval Power’, or words to the same effect).
2) Clearly the main story is the enormous deviation between (aggregate) Target and (aggregate) FinalMW over a ~30 minute period in the middle of the day
3) But also worth noting some (separate) apparent glitch in the AEMO’s aggregate UIGF value (via ASEFS) at the 13:35 dispatch interval:
(a) Not explored further here
(b) But perhaps in some future article?
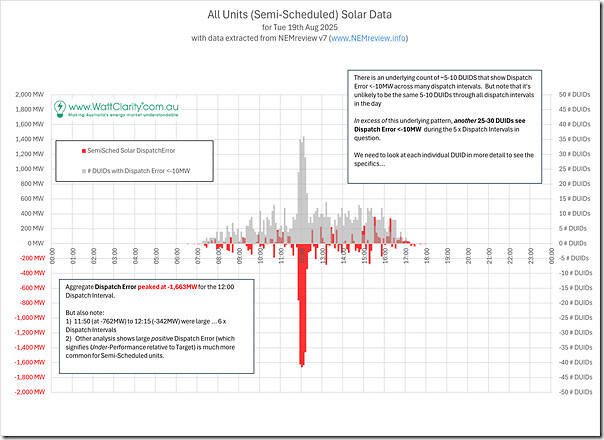
Chart 2 = aggregate Dispatch Error, across all Solar Farms
In the second card we’ve calculated Dispatch Error across all 106 x Solar Farms for each of the 288 dispatch intervals in the day – and then aggregated to give a Solar-Wide total:
Note that:
1) ‘Dispatch Error’ is defined by the AEMO as Target – FinalMW, and we calculate this here
2) This means that a negative Dispatch Error means over-performance relative to Target
3) Which, in the context of the frequency spike on Tuesday 19th August 2025, certainly makes sense.
Also shown on the same chart is a trended count (across all 106 x Semi-Scheduled Solar Farm DUIDs) of the number of DUIDs that showed its own discrete Dispatch Error < -10MW:
1) For that DUID
2) In that particular Dispatch Interval
We can see that, using this threshold, there are something like 5-10 DUIDs meeting this criteria in most of he ‘sunlight hours’ Dispatch Intervals across the day
… though note that the specific DUIDs in this set is almost certainly changing from one dispatch interval to the next.
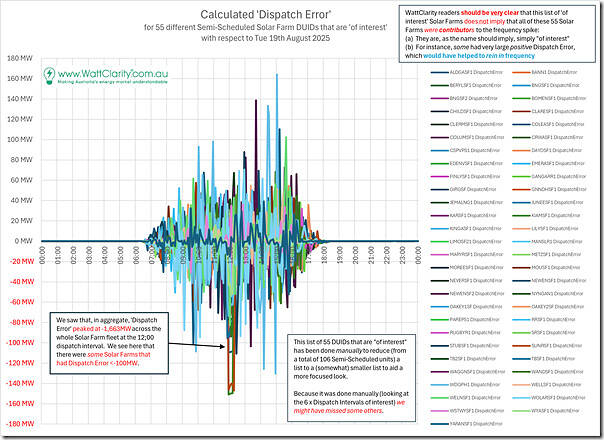
Chart 3 = trimming the list of Solar Farms to a smaller list of Solar Farms ‘of interest’ (though still not small enough!)
I’m interested to delve further into the situation at individual DUIDs, but 106 solar farms is too many to investigate one-by-one with widgets like the ‘Unit Dashboard’ widget in ez2view
… and certainly too many to write about individually, given the writing takes longer than flipping between units in the ‘Unit Dashboard’ widget!
So, as a first attempt to trim the list, I manually eyeballed a tabulated list of ‘Dispatch Error’ and removed columns in the spreadsheet that did not seem ‘of interest’ (i.e. using a method where, by eyeball, the Dispatch Error across those 6 x Dispatch Intervals was small).
Note that in this process I might have inadvertently removed some that might still be ‘of interest’ but there’s some take-aways here:
1) 55 units remaining is still more than I would have hoped
2) Readers need to be very clear that the list of 55 units does not mean all of them had large negative Dispatch Error during that period (hence ‘to blame’ … oh, I dislike that term … for driving frequency up)
… indeed, some stood out to me as having quite sizeably positive dispatch error (which would have helped restrain frequency) and I wondered how that came about?
3) Across all 55 DUIDs, there’s a large degree of variability
4) Some units saw ‘Dispatch Error’ individually greater than 100MW:
(a) In either direction
(b) At different parts of the day.
… Wow!
So I have trimmed the list (but not enough to make it ‘easy’ for me in the next steps) … and that’s where we’ll leave this article!


Leave a comment