Over the past week (and particularly Wednesday 11th June 2025 and Thursday 12th June 2025) gas-power generation ran strongly in Victoria. This was due to a number of factors, including:
- Underlying Demand driven higher by cold weather
- Seasonal low in solar, and a weather-pattern induced low for wind generation
- Some coal units out … 3 of 10 in Victoria and others in NSW and QLD.
- And perhaps more factors (have not looked in detail).
Well, that certainly seemed to get some people talking – on social media, and even in news media articles.
But I wondered what all the fuss was about, so today have grabbed NEMreview v7 and extracted some daily average production statistics from all gas-powered generation in Victoria over 26.5 years since the start of the NEM.
Two charts to sum up … how remarkable was this?
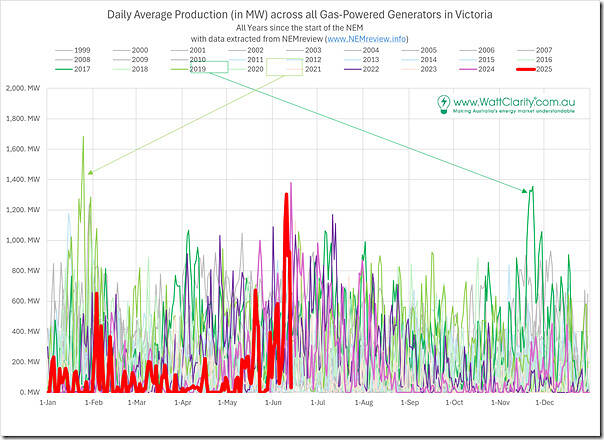
Let’s start with this chart that plots ~10,000 data points – being daily average aggregate production stats across all gas-powered generation in Victoria, but shown by day of year … noting most years are ‘missing’ 31st December because of the substitution of 29th February in every year to line up with leap years:
With 27 years shown, I’ve singled out a couple notable ones to highlight:
1) There was a pronounced spike in production for November 2017 in general, and some days in particular:
… interestingly, with a quick review of articles published in November 2017, I can’t see anything particularly relevant to the spike in production.
2) There was a pronounced spike in production for January 2019, particularly in the latter half of the month:
… to help provide some context, I’ve linked to the article ‘Looking backwards over the past 2 weeks in the NEM’ that was published on 30th January 2019.
3) The 2022 calendar year is highlighted because of some high points, particularly in the colder months of 2022:
… readers here will recall the 2022 Energy Crisis
4) The 2024 calendar year is highlighted, particularly because of higher production during the colder months of 2024:
… readers here will recall the 2024 Q2 Wind Lull.
5) And finally we’ve highlighted 2025 year-to-date
… particularly with its spike in GPG production over the past week.
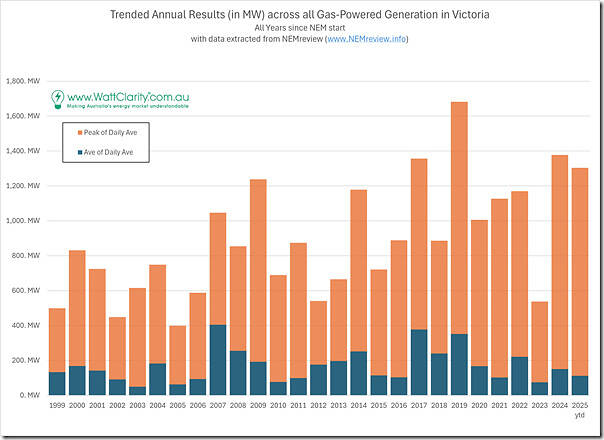
The above chart is quite busy, so I’ve taken the data and identified the ‘average of daily averages’ and the ‘peak of daily averages’ in this trend across 27.5 years:
With this view:
1) we can see that the recent years have seen peak production levels climb (compared to the first years of the NEM) …
(a) though, on further reflection, we need to take account of the larger installed capacity base of gas-powered generation in VIC
i. … such as the Mortlake peaking station
ii. Whereas I can’t think (off the top of my head) of any major gas peaker in Victoria closed since the start of the NEM?
(b) Coupled with this, probably worth noting that, if there had been more capacity available last week (and assuming the fuel) then the market prices were surely sufficient to incentivise it to run
2) but it’s more difficult to see a pattern in year-on-year change in average production levels
3) it is quite clear that the ratio of peak-to-average is large (and getting larger)
A few different ways of thinking (and speaking) about the above?
Notwithstanding that some people just like to shout (especially if they inhabit either end of the Emotion-o-meter, with respect to this energy transition) there might be several different ways of looking at these results
1) Some might view this and take the line ‘see, recent years illustrates that there’ll still be a need for gas-powered generation!’
2) But for me personally, I look at the above and think ‘not sure what all the fuss was about?’
… after all, we’ve written a number of times (including with respect to the ‘Green shoots of pragmatism at the CEC’s Clean Energy Investor Forum in Sydney on 3rd April 2025?’) that…
‘The (new) NEM needs to have a lot of gas available, but to use it very little’.


I agree with the conclusion that the story was largely a beat-up. Your chart shows that average daily Vic gas generation so far this year is below last year.
As to whether the peak would have been higher with more gas~fired capacity? Even at the extreme prices of last week there was some capacity undispatched, because it was only offered at even higher prices.
You are right.
It was another beatup. There was a severe wind drought for three days and poor solar as well but gas peaked at about 75% capacity and averaged 26% for the week. On most days where gas generation is required, 2 GW/5 GWh of storage would displace it entirely. Further as wind and solar capacity increase coal and hydro utilisation will decline during normal operating conditions, leaving even more capacity to fill the gaps in wind and solar