This is my second article today relating to events on Monday 26th May 2025 (i.e. 7 days ago now). As noted earlier:
1) Through the day as already noted here in an earlier article, it was heavy wind production across all wind farms across the NEM
… peaking at a new all-time maximum (9,287MW as FinalMW for the 21:35 dispatch interval NEM time on Monday 26th May 2025).
2) Also as noted in a different article earlier, there were many Dispatch Intervals seeing significant Aggregate Dispatch Error across all Semi-Scheduled units of both fuel types
… i.e. both:
(a) for Large Solar (which showed a yo-yo pattern through most daylight hours); and
(b) for Large Wind, which was much more consistently underperforming with respect to Target.
3) Of particular interest was a drop in mainland NEM frequency to below the NOFB just after the end of the 16:15 dispatch interval
… with a contributor noted that ‘Poor dispatch performance of VRE (collectively) on Monday 26th May 2025 sufficiently large to drive frequency outside of NOFB’.
Readers please take note…
Readers should note … nothing in this article should be read:
1) as attributing ‘blame’ to any individual DUIDs
2) or implying any particular ‘wrongdoing’ in relation to the requirements for Semi-Scheduled units to operate in the NEM:
(a) operational requirements for which are looser than they are for fully Scheduled units;
(b) which has had us wondering for many years ‘is the Semi-Scheduled category scalable and sustainable?’.
So it’s examples like this that have us wondering (as distinct from wandering) further…
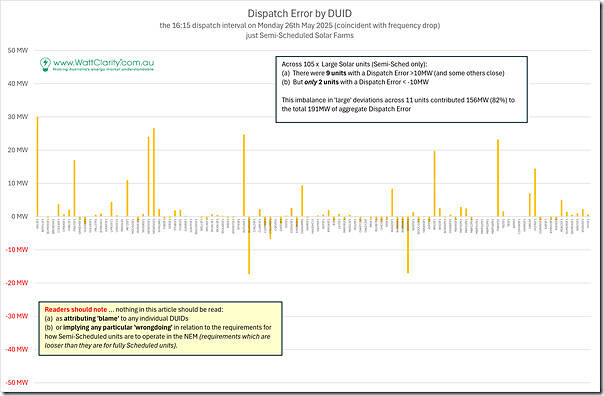
Dispatch Error across each of 105 (Semi-Sched) Solar Farms
There were 105 Large Solar Farms registered on the day, and operating as Semi-Scheduled units. In the following chart, we plot the Dispatch Error across all of these 105 units:
With respect to solar units, there’s a few particular particular notes:
1) First and foremost, see that there is a definite skew ‘above the zero line’ … in other words:
… in other words, there are many more DUIDs displaying individual underperformance (55% of total) than there is overperformance (36% of total) of any size in this dispatch interval (noting that there were some units offline entirely).
2) This was even more pronounced when looking at the large deviations (say greater than 10MW in absolute terms):
(a) There were 9 units with a Dispatch Error >10MW (and some others close)
(b) But only 2 units with a Dispatch Error < -10MW
3) The aggregate imbalance of these ‘large’ deviations across 11 units contributed 156MW (82%) to the total 191MW of aggregate Dispatch Error.
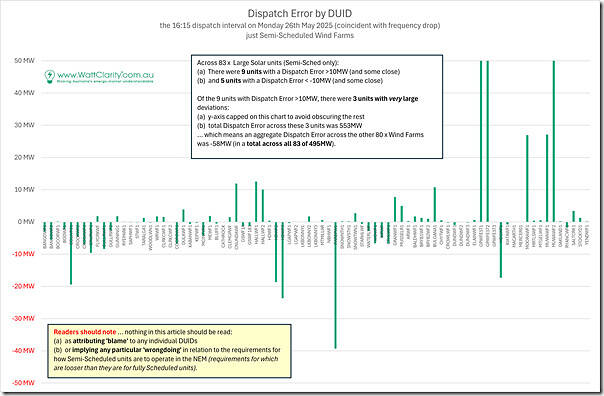
Dispatch Error across each of 83 (Semi-Sched) Wind Farms
There were 83 x Wind Farms registered on the day, and operating as Semi-Scheduled units. In the following chart, we plot the Dispatch Error across all of these units:
To me it seems like the situation across the Wind Farms is noticeably different than it was the Large Solar Farms above.
1) First and foremost, note that there were 3 Wind Farm DUIDs that each had very large deviations of underperformance compared to Target in this dispatch interval
(a) the y-axis has been intentionally capped here, so these results don’t mask the rest of the story.
(b) in aggregate this represented 553MW aggregate Dispatch Error for just those 3 x Wind Farm DUIDs.
2) In numerical terms, there seemed to be more balance in the # units ‘under and over’ compared to the Solar Farms:
(a) There were 39 units underperforming (47%) compared to 36 units overperforming (43%)
(b) Aggregating them up, (excluding the big 3) the 36 units underperforming totalled to +145MW and the 36 units overperforming totalled to -202MW
3) So in aggregate terms, the Aggregate Dispatch Error across all Wind Farms (495MW) was driven by the collective Large Deviation across just 3 x Wind Farms.
That’s where we’ll leave this next part of the analysis…


Leave a comment