In the past couple weeks, we have already published two similar articles:
- On 1st February, we posted ‘A trend of daily peak NEM-wide ‘Market Demand’– from 1st January 2008 to 31st January 2025’.
- On 2nd February, we posted ‘A trend of daily peak Victorian ‘Market Demand’– from 1st January 2008 to 1st February 2025’.
… so today we post the third in the series, given that today ‘… could be a big day for ‘Market Demand’ in South Australia’, with ‘Market Demand’ potentially as high as 3,200MW as noted in that article.
(A) Another reminder about the complexity of measuring ‘Demand’ …
…. because it’s not as simple as some might initially think.
Note this ‘A brief reminder about the complexity of measuring ‘Demand’ …’ here.
With this in mind, let’s look on….
(B) A long-range trend of daily peak
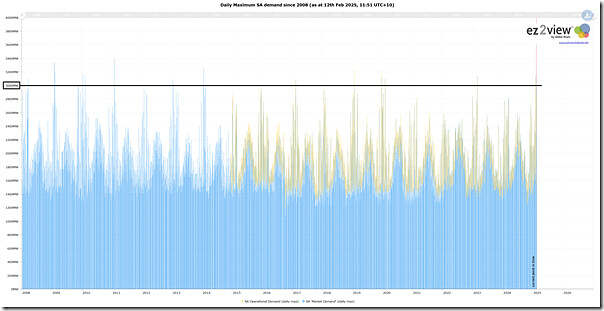
So utilising the ‘Trends Engine’ within ez2view we’ve put the following trend together, showing both ‘Market Demand’ and ‘Operational Demand’ (noting that reconstructing an estimate of ‘Underlying Demand’ over such a long time range is more complex and we don’t have time to do this today for this brief article.
Remember to click on the image for a larger-resolution view.
For ease of reference, I’ve added a horizontal line:
1) at 3,000MW (only 22 days have seen higher since 1st Jan 2008)
… so that’s in the past > 17 years
2) but I should have added a horizontal line at 3,200MW (only 5 days have seen higher … in 6,252 days (so 0.080% incidence)
(C) A tabular listing of some of those high demand days
With the above chart as a reference, here’s some of the high points in each year noted (with some linked to articles written at the time).
| Year | Brief Explanation of the top demand days (in South Australia) in each year, in terms of ‘Market Demand’ |
|---|---|
|
2008 |
1 day over 3,000MW:
|
|
2009 |
3 days over 3,200MW in January 2009:
plus 3 other days over 3,000MW |
|
2010 |
3 days over 3,000MW:
|
|
2011 |
1 day over 3,200MW:
|
|
2012 |
0 days over 3,000MW |
|
2013 |
2 days over 3,000MW:
|
|
2014 |
2 high days in January 2014:
… plus:
|
|
2015 |
0 days over 3,000MW |
|
2016 |
0 days over 3,000MW |
|
2017 |
1 day over 3,000MW:
|
|
2018 |
0 days over 3,000MW |
|
2019 |
2 days over 3,000MW:
|
|
2020 |
January 2020 saw :
|
|
2021 |
0 days over 3,000MW |
|
2022 |
0 days over 3,000MW |
|
2023 |
1 day over 3,000MW:
|
|
2024 |
0 days over 3,000MW |
|
2025 ytd |
This year is only very young … only 1 month + a few days old.
|
So let’s wait to see what unfolds…


Leave a comment