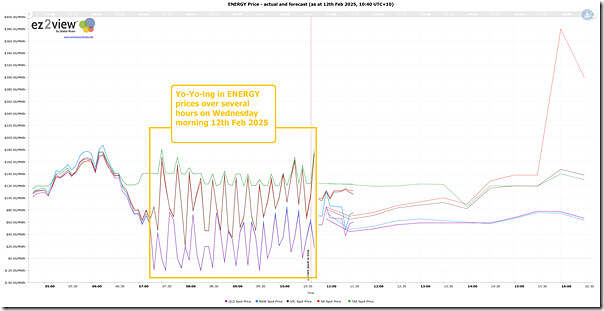
Several readers and NEM-watchers have separately noted to me a case of whiplash from oscillating prices this morning, highlighted in this ‘Trends Engine’ chart at the 10:40 dispatch interval (NEM time) from within ez2view on Wednesday morning 12th February 2025:
These oscillations are understandably playing havoc with targets for units sensitive to price ranges from –$20/MWh to $200/MWh in their bids (i.e. many of them).
Amongst the curiosities that we’ve noticed, and a possible contributing factor, are the two Constraint Equations that are invoked as a member of the ‘N-BU_330_TX_ONE’ constraint set:
1) Which became invoked this morning from the 06:05 dispatch interval
… and is a new constraint set just created on 11th February 2025 (i.e. yesterday).
2) Pertaining to an outage on one Buronga 330/220 transformer (#7 or #8)
… which I think is part of the Project Energy Connect.
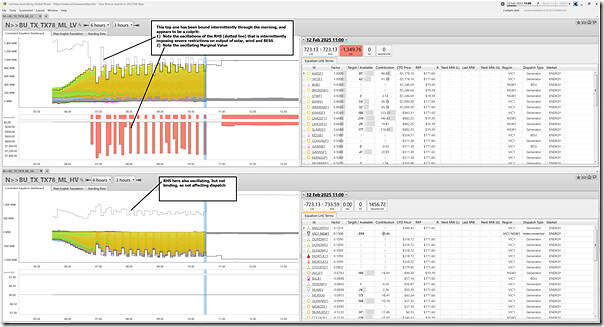
Here’s a snapshot from a collage of 2 copies of the ‘Constraint Dashboard’ widget in one window at the 11:00 dispatch interval showing both of the constraint equations:
At the top we have the ‘N>>BU_TX_TX78_ML_LV’ constraint equation, which:
1) relates to:
‘Out= one Buronga 330/220 transformer (#7 or #8), avoid O/L Buronga 220/330kV #7 transformer on trip of Murraylink, Feedback’
2) We can clearly see some major jumps up-and-down in the RHS of this constraint
… which we deduce is driving the constraint to bind, and then unbind.
3) From the widget we can quickly access the ‘Plain English Translation’ (so called) that shows the form of the RHS as follows:
‘Dispatch RHS=
4.321 x (Min
(
(NRAT30_BU_TX8
– MVA flow on Buronga #8 330/220kV Transformer
– 0.8646 x [MW flow west on the Murraylink DC Interconnector]),
(NSW: Buronga 220/330kV #7 transformer 30 min rating
– MVA flow on Buronga #7 330/220kV Transformer
– 0.8646 x [MW flow west on the Murraylink DC Interconnector])
)
– 0.8646 x [MW flow west on the Murraylink DC Interconnector]
– 10 {Operating_Margin})
– 0.11 x [MW flow north on the Vic to NSW AC Interconnector]
+ 0.232 x [Ararat wind farm]
+ 0.0783 x [Avonlie solar farm]
+ 0.0848 x [Ballarat Battery BDU]
+ 0.868 x [Bannerton solar farm]
+ 0.938 x [Broken Hill Battery BDU]
+ 0.938 x [Broken Hill solar farm]
+ 0.284 x [Bulgana Battery BDU]
+ 0.284 x [Bulgana Wind Farm]
+ 0.506 x [Cohuna Solar Farm]
+ 0.123 x [Coleambally solar farm]
+ 0.25 x [Crowlands wind farm]
+ 0.127 x [Darlington Point solar farm]
+ 0.127 x [Darlington Point Battery BDU]
– 0.109 x [Dundonnell Wind Farm 1]
– 0.109 x [Dundonnell Wind Farm 2]
– 0.109 x [Dundonnell Wind Farm 3]
+ 0.506 x [Gannawarra Battery BDU]
+ 0.506 x [Gannawarra Solar Farm]
+ 0.0995 x [Glenrowan West Solar Farm]
+ 0.506 x [Kerang Solar Plant]
+ 0.538 x [Koorangie BESS BDU]
+ 0.127 x [Hillston solar farm]
+ 0.0898 x [Hume (Vic) hydro]
+ Karadoc Solar Farm
+ 0.826 x [Kiamal Solar Farm]
+ 0.409 x [Kiata Wind Farm]
+ 0.668 x [Limondale 1 solar farm]
+ 0.668 x [Limondale 2 solar farm]
– 0.131 x [Macarthur wind farm]
+ 0.0995 x [Mokoan Solar Farm]
– 0.109 x [Mortlake GT unit 1]
– 0.109 x [Mortlake GT unit 2]
+ 0.0951 x [Murray hydro (14 aggregated units)]
+ 0.502 x [Murra Warra Wind Farm stage 1]
+ 0.502 x [Murra Warra 2 wind farm]
+ 0.122 x [Numurkah Solar Farm]
+ 0.127 x [Riverina 1 Battery BDU]
+ 0.127 x [Riverina 2 Battery BDU]
– 0.0802 x [Stockyard Hill wind farm]
+ 0.938 x [Silverton wind farm]
+ 0.668 x [Sunraysia 1 solar farm]
+ 0.868 x [Wemen Solar Farm]
+ Yatpool Solar Farm
+ 0.085 x [Yendon Wind Farm]’
… so a combination of network flows etc (coloured like this) and feedback terms (i.e. on unit outputs at the start of each dispatch interval, and coloured like this).
4) Note the curious addition of the third Murraylink term (highlighted in red) which would seem to have the effect of subtracting Flow West twice from the RHS.
At the bottom we have the sibling constraint, the ‘N>>BU_TX_TX78_ML_HV’ constraint equation, which also shows oscillation of RHS … but is not binding so is not affecting dispatch outcomes.


Leave a comment