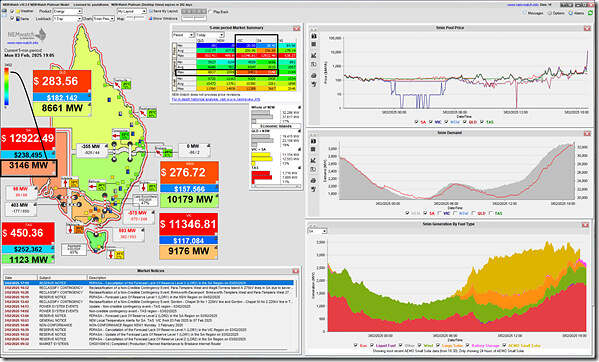
Let’s start with this snapshot from NEMwatch at the 19:05 dispatch interval (NEM time) on Monday 3rd February 2025:
We’re providing this for context, even though the relevant demand records are not occurring at this precise dispatch interval. Note in particular that:
1) All four mainland regions are above the ‘deep green’ zone, signifying various levels of elevated demand relative to their historical range.
2) In particular:
(a) QLD and NSW are slightly elevated;
(b) Whilst (at this time) VIC and SA are moreso elevated … with SA more elevated than VIC in relative terms.
With respect to today’s demand peak (and remember that we’re speaking about ‘Market Demand’ here) please see the following context:
| Region | Today’s demand peak,
… measured as ‘Market Demand’ |
Some more context |
|---|---|---|
|
NEM-wide demand |
The high point for NEM-wide demand was 32,925MW in the 18:30 dispatch interval (NEM time). |
On the weekend we posted this ‘trend of daily peak NEM-wide ‘Market Demand’– from 1st January 2008 to 31st January 2025’. So we can note at the same time that: 1) This level was lower than earlier forecasts. 2) But, at the same time … (a) in the 6244 days between 1st January 2008 to 3rd February 2025 today would rank as 35th on the list (so in the top 0.561% of all days) (b) What’s more, in the days that rank above on the list, there were only 11 days since 1st January 2015 (i.e. a little over 10 years ago). … so a notable day on a NEM-wide basis (though just a shade below 33GW).
|
|
Victorian demand |
The high point for Victorian demand was 9,491MW in the 18:40 dispatch interval (NEM time). |
Also on the weekend we posted this ‘trend of daily peak Victorian ‘Market Demand’– from 1st January 2008 to 1st February 2025’. So we can note at the same time that: 1) This level was lower than earlier forecasts. 2) But, at the same time: (a) in the 6244 days between 1st January 2008 to 3rd February 2025 today would rank as 17th on the list (so in the top 0.27% of all days) (b) What’s more, in the days that rank above on the list, there were only 2 days since 1st January 2015 (i.e. a little over 10 years ago) were as follows: i. Friday 31st January 2020 at 9,608MW; and ii. Monday 16th December 2024 at 9,887MW … so it’s clear it was a remarkable day in Victoria.
|
|
South Australian demand |
The high point for South Australian demand was 3,150MW in the 19:10 dispatch interval (NEM time). |
We’ve not had time to write a similar article showcasing the long-term trend of daily peak demand in South Australia … perhaps sometime soon? But we did extract the data this evening and see that: 1) in the 6244 days between 1st January 2008 to 3rd February 2025 today would rank as 8th on the list (so in the top 0.128% of all days) 2) What’s more, in the days that rank above on the list, there are 0 days since 1st January 2015 (i.e. a little over 10 years ago) were as above! (a) The most recent day was Thursday 16th January 2014 at 3,259MW (b) That was 4,036 days ago … before the pattern of declining demand took full swing. … so it’s clear it was a remarkable day in South Australia.
|
So we’ll leave the analysis here, for now…


Leave a comment