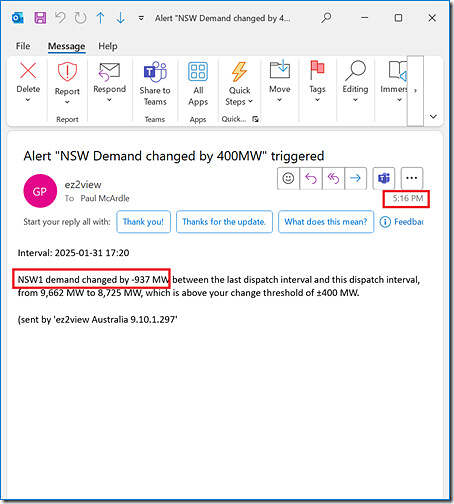
Coincident with the walk home this afternoon/evening, the ‘Notifications’ widget in one of our display copies of ez2view alerted us to a large drop of ‘Market Demand’ in the NSW region … at a 937MW drop in the 5 minutes to 17:15 NEM time, this was well above the 400MW trigger level set for the alert on the basis that it very seldom triggers:
So now that I’m home, I thought I’d take a quick look, to see what’s immediately apparent.
Q1) What’s visible in NEMwatch?
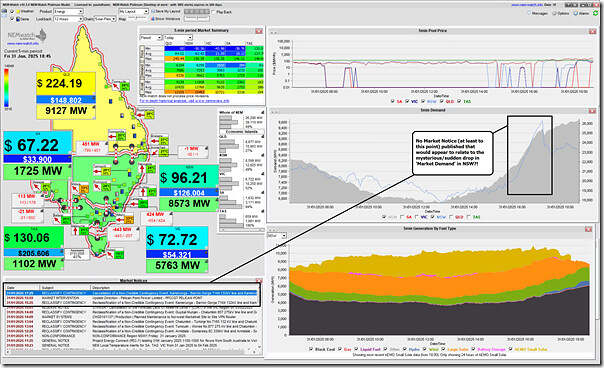
Opening up the NEMwatch application at the 18:45 dispatch interval we see the following:
As noted on the image:
1) We can clearly see the drop shown in the trend line for NSW ‘Market Demand’ (and even behind that in the grey shaded trend for NEM-wide ‘Market Demand’ ) … and there’s also a sizeable (but slower) ramp up in demand before then.
2) But, somewhat surprisingly, there’s no Market Notice issued by AEMO that might help explain (which makes me wonder if the data is ‘real’ or related to some form of glitch?)
Food for subsequent digging…
Q2) What’s visible in NEM Mainland Frequency?
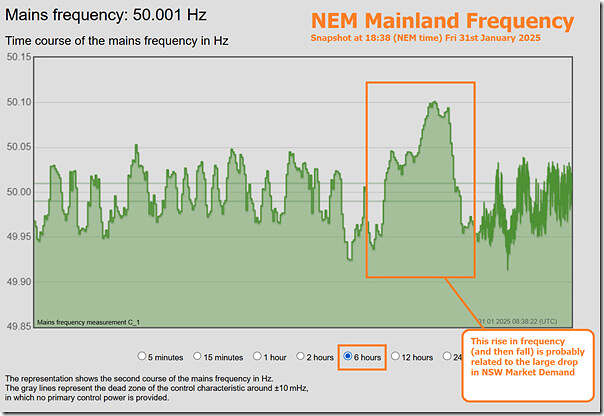
We have browser-based charts trending NEM Mainland Frequency, but mine had gone to sleep on the walk home so refreshing meant the sample steps in the chart earlier than an hour ago are more chunky than I’d like – but that’s what we’ll have to work with at this first step:
Now we can see a ramp up in system frequency disruption … but it’s not really what I was expecting to see:
1) If the ~950MW loss of consumption was instantaneous (e.g. if all potlines of the aluminium smelter tripped, or a major city suddenly lost load for some reason), we’d expect to see frequency spike very quickly and probably outside of the Normal Operating Frequency Band
2) But that’s not what we see, so this just leads to more questions about what actually went on.
Q3) What about the VIC-NSW interconnector?
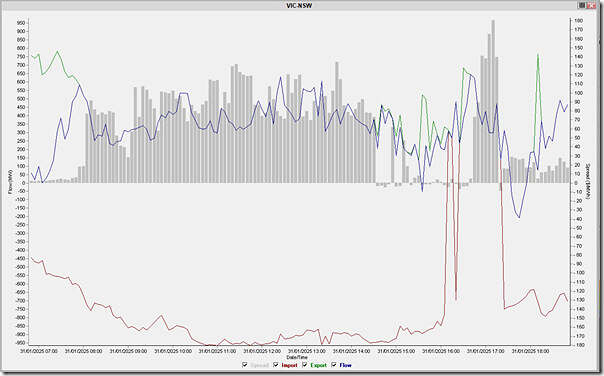
Given our ongoing and growing curiosity about the operation of the VIC1-NSW1 (remembering the caveat that ‘interconnectors’ are not one and the same as transmission lines) we click the button in NEMwatch to open up the interconnector view and have included it here – snapshot at 18:50 but with the 17:20 dispatch interval highlighted.
Again more questions … for a subsequent article!
No time for more, now – but if any of our more knowledgeable readers have theories (or facts!) please feel free to let me know via comments below, or directly?!


Looks like a data error – I imagine the overfrequency was *prior* to the drop, as AEMO was dispatching generation well in excess of the actual demand.
Monday evening demand also looks a little suspect – just not as blatant!
I sort of agree but it’s not a data error. A 0.12 hz frequency swing on a 26GW system is a bit under 900 MW based on 4% droop and a bit of vagaries in hydraulic governor systems.
It is a data error – go plot the frequency vs demand. Over-frequency sitting at edge of PFR band from 16:35 when NSW demand starts going crazy, breaks through PFR band around 16:55… and then starts dropping back to normal over course of 17:15 -> 17:20. Ie AEMO had a data/forecasting error such that they were over-procuring generation earlier in the afternoon, and the -1000mw demand drop was taking it back in line with actual demand – over that dispatch interval the surplus generation situation reverts to normal, with frequency dropping back to ~nominal.
Thanks to both of you, I’ve invested some time on Monday to post ‘Last Friday’s large and (mysterious) apparent drop in NSW ‘Market Demand’ appears some data glitch?’.
Thoughts?
Pretty much spot on HR10 – between DI 15:55 and DI 17:15 something screwed up AEMO’s calculation of NSW actual demand from metered generator outputs and interconnector flow levels. You can verify this from the relevant MMS tables. Between 15:55 and 16:30 the calculation was too low, then up to 17:15 it was too high. The problem got fixed for the 17:20 DI which explains the sudden “demand drop” for that interval. These errors correlate reasonably well with frequency being on the low side of the PFR band between 16:05 and 16:30, then on the high side until 17:20.