Editor’s Note – This is the text of a speech presented by Philippe Orhan at All-Energy in Melbourne on Thursday 24th October 2024.
Philippe’s talk was the fourth of 4 presentations that Paul noted in his article ‘‘Operating in the NEM’ … from All Energy 2024’. With the publication of Philippe’s articles, WattClarity® now features articles from all four presenters from that session.
Neoen’s journey in the NEM
Neoen’s journey in the NEM started 12 years ago. As a developer of exclusively renewable energy (with a focus on large scale solar, wind and storage technologies), Neoen has adopted a “develop-to-own” model, keeping ownership in the long-term, operating our assets on the various markets we are active in.
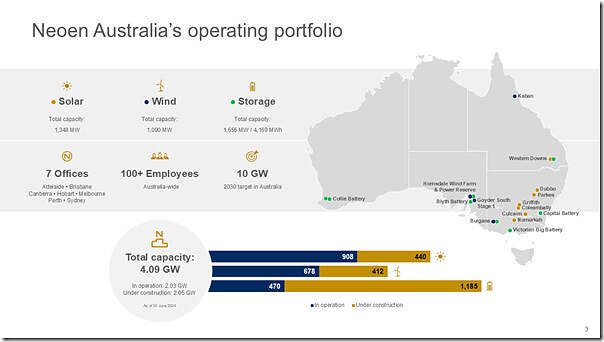
In Australia, this strategy led Neoen to be operating a diverse portfolio of over 2GW of clean energy, over all mainland states of the NEM. We most recently made our entry into Western Australia and the WEM, which has highlighted some interesting specificities of both markets.
While the core of Neoen’s activities was focused on the development and delivery of projects, this focus gradually shifted towards the intricacies of operating a large renewables portfolio in the NEM.
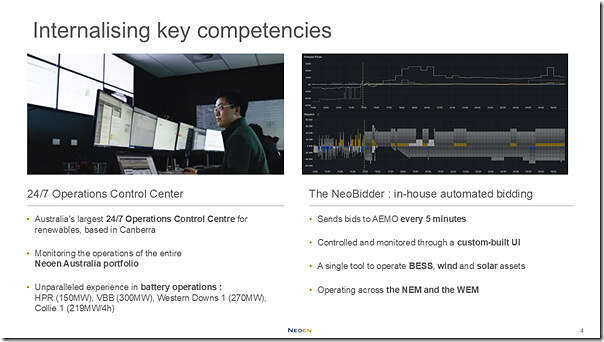
While the portfolio grew in size and diversity, a few key decisions shaped the way we are interacting with the NEM today. First, the establishment of our own 24/7 Operations Control Centre, based in Canberra in 2018. The team is working round the clock, monitoring the entire portfolio in the NEM and the WEM, managing the bidding into the market.
As Pan highlighted in his presentation, the NEM is a highly volatile market. The experience that this team is accumulating over time, as well as their ability to react quickly to unforeseen events, is critical to the success of our operations. Given the early development of Neoen’s storage portfolio, they have accumulated an unparalleled experience in battery operations.
The second milestone relevant to today’s topic is the development of our internal automated bidding algorithm. If you’ve read Alex’s article on big batteries revenues, you’ll easily understand that operating batteries manually in the NEM would prove inefficient. Keeping this competency internally is critical in developing a tool that is tailored to the needs of the Operations Control Center and the specificities of Neoen’s portfolio.
Data in the NEM : opportunities
With this context in mind, this presentation endeavours to share some insights we learned along the way, and shed some light on the unique role of data in this market and the opportunities and challenges a market participant faces.
Data is central to the way the NEM is operating, and surprisingly the approach is very different from other electricity markets in the world. A few aspects to keep in mind :
An unparalleled amount of data available
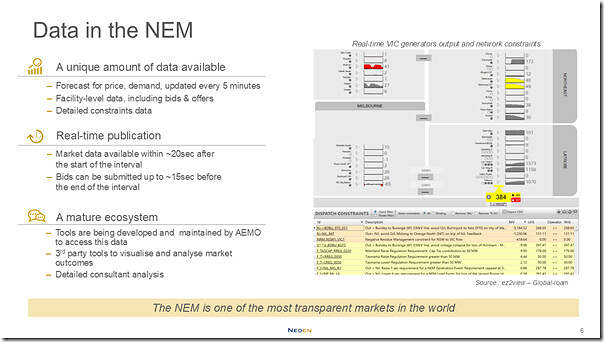
Overall, transparency is the norm of this market, with AEMO making available to market participants virtually all the data they can dream of. AEMO is releasing every 5 minutes all outputs of the NEM Dispatch Engine, which include :
(a) Usual market characteristics such as demand, price, generation mix, etc
(b) State of all network constraints
(c) Facility-level details, allowing participants to see their competitors production
(d) Prices are even computed over the forecast horizon on a range of scenarios
This data is available not only for the current dispatch interval, but also over the P5 and predispatch horizons.
It’s easy to take this data for granted, but this level of transparency is far from the norm on electricity markets. Most markets will release only aggregated data, and you can forget about short-term forecasts.
An efficient real-time approach
As a consequence of the real-time nature of the NEM, all this data is released in real-time to market participants, allowing them to quickly react and adapt to any changes in the market or with their plants physical capabilities.
After the start of an interval, AEMO usually releases all this data within around 30 seconds, and accepts bids until 15 seconds before the start of the next interval (some call this ‘Gate Closure #2’). NEMDE is therefore collecting data, solving the market (again, not only for the current interval but all the intervals on the horizon), and sending the data across in less than a minute. This is no small feat, and allows participants ample time for an algorithm to produce an optimisation and send their bids across.
Once again, this contrasts greatly with other markets, which can be on a day-ahead or hourly granularity.
A mature ecosystem
These characteristics have allowed the growth of a mature ecosystem, helping participants to tap into this data, understand the market dynamics and optimise operations. AEMO itself has developed tools to manage market data efficiently, and a range of actors have developed solutions to analyse, visualise and draw insights from this data.
A good testimony to this is the time it takes between a market event and a post from Paul McArdle on WattClarity (a matter of minutes).
Contrast to WA, and the WEM?
The value of this ecosystem became apparent when we entered the WEM : while AEMO operates that market and is also doing a great job at publishing data in real-time, the market is much smaller and participants are left to develop their own solutions to access it efficiently.
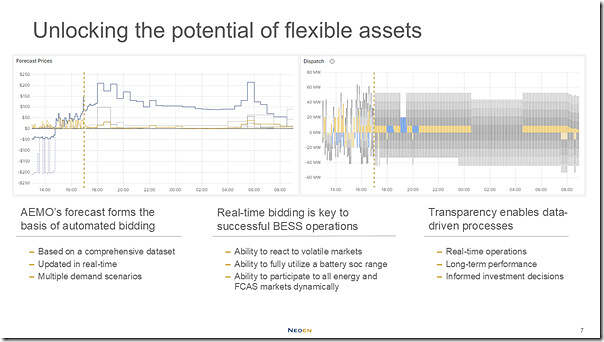
These features of the market have been critical to unlock the potential of flexible assets, and in the rise of large-scale storage.
Once again referencing Alex, batteries are inherently highly flexible assets, and their value is therefore realised when they are able to tap into this flexibility, co-optimising between the various services on a real-time basis.
Another parallel with the WEM : a 15-minutes “gate closure” is in place, meaning that rebids made for economic reason need to be locked in 15 minutes before the interval. While 15 minutes can seem like a short-time, there is more uncertainty when a bid is locked in (e.g. what will my battery state of charge be 15 minutes from now?). This results in additional buffers taken in operations, and therefore slightly less optimal operation.
Forecast data, in the NEM
The forecast data published by AEMO also forms the basis of all automated bidding systems, as the purpose of such algorithm is to form a view on what will happen in the short term in order to take the best decision now. While machine learning models are being developed, I’d be surprised if models are completely ignoring AEMO’s data, which is based on a range of data sources not directly available to participants. It drastically reduces the barrier to entry to develop such automated systems.
Data in the NEM : pitfalls
Now that we’ve had an overview of how helpful the NEM’s relationship to data can be, this does not come without its challenges, especially for companies such as Neoen that are not inherently data or software companies.
The IT challenge
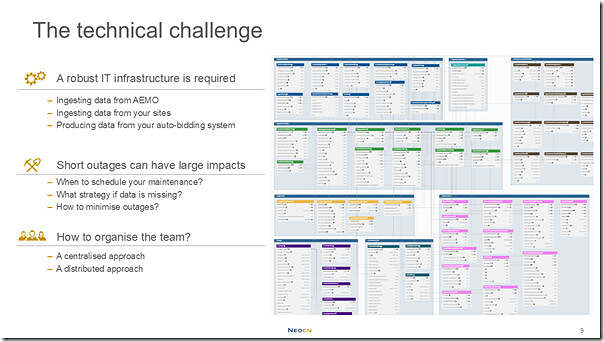
Operating an automated bidding system requires careful management from various data sources : the market data coming from AEMO, which spans hundreds of tables; the telemetry data from your assets; and the data produced by the automated bidding system itself.
To give an order of magnitude: an automated bidding system for a bess produces bids for up to : 14 market/direction pairs, 288 intervals in the forecast horizon, for each of the 288 intervals of the day. A multitude of data points are saved for each (targets, pricebands, configuration, etc), adding up to tens of millions of data points produced per day.
A robust database infrastructure is required to manage this volume in real time. Even short outages can have large impacts given the nature of the NEM, posing additional challenges : how to schedule maintenance? What strategies to prepare when, inevitably, some data points will be missing? How to design a resilient system, but still ensure issues are identified and timely addressed?
As is often the case in the IT world, the teams organisation can vastly influence the way that these issues are tackled. When it comes to data management, there are two main schools of thought :
1) A centralised approach, where a dedicated data team is directly interacting with the infrastructure, taking requests from other departments and building dashboards, queries, ready to use. This prevents unexperienced users from hindering the infrastructure performance with il-designed requests, but the main risk is that the data team becomes a bottleneck, introducing friction and slowing every other team even for simple requests.
2) A decentralised approach, where teams are building their own queries and dashboards – this approach reduces friction as everyone is free to access the data as required, but requires proper training and strict documentation for every user to understand the data and the limitations of the infrastructure.
Empowering real-time decision making
As described earlier, decisions in the NEM are fast-pace. Real-time data access is therefore critical, but is not a sufficient condition to efficient decision-making.
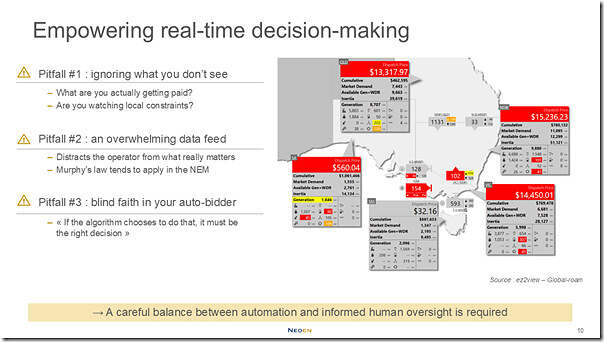
Here are a few pitfalls to avoid :
1) Ignoring what you don’t see.
When you have 5 screens spitting numbers in front of you, it’s easy to trust what you are seeing. But this data is often not showing the full picture.
One illustration : renewable assets are often not paid at the spot price. In between your PPA price, it’s negative price clause, FCAS cost recovery, LGC trading, something as trivial as “what revenue is my asset generating right now?” is not straightforward to monitor.
2) An overwhelming data feed.
At the other end of the spectrum, is the tendency to watch and monitor everything : visual alerts, notifications are easy to set up. But when something goes wrong in the NEM, it’s often causing a cascading chain reaction. Too many notifications can distract you from focusing on what really matters for your portfolio.
3) Blind faith in your auto-bidder
The rise of auto-bidders (which has been discussed in a range of articles tagged here) in is posing another challenge for real-time decision making. Operating on many co-optimised markets simultaneously, it can be challenging to understand what it’s doing or why. It can therefore be tempting to trust it implicitly. But just as a human watching the market is not aware of everything, your auto-bidder is only as good as the inputs and strategies it is fed with – and it can therefore ignore important factors at times.
This will join one of the conclusions of James’ presentation : a careful balance between efficient automation and informed human oversight is key.
The analysis paralysis
This last point relates more to long-term analysis than real-time operations. With the wealth of data available at a 5 minute granularity in the NEM, the common trap is to dive deep in the data, end up at some point lost in the data and losing sight of the bigger picture.
To avoid this, analysts have long been working on aggregated data, and building simplified KPIs to extract long-term trends and insights. However, this can sometimes hide a crucial part of the phenomenon we are trying to describe.
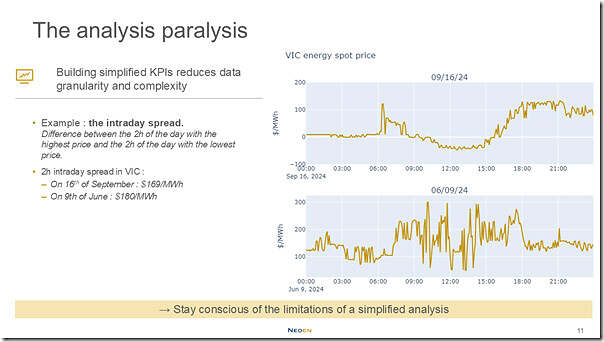
For instance, when analysing battery performances, the intraday spread is often used as a proxy for the revenue potential of the battery on a particular day (just like the average price will be used for a generation asset). For more detail on the definition of the intraday spread, refer to the presentation by Alex.
I have cherry-picked two days in VIC with similar intraday spreads : the 16th of September, with a 2h intraday spread of $169/MWh, and the 9th of June, with an intraday spread of $180/MWh.
Judging by these numbers, a battery should get similar revenues on both days. But if we look at the 5min data, two very different realities emerge :
1) The 16th of September had a usual profile, with negative prices in the afternoon allowing to charge the battery, and a consistent evening peak where a battery would be allowed to discharge above $100/MWh.
2) The 9th of June, on the other end, sees prices jumping up and down in the middle of the day, with swings of more than $200/MWh between intervals, without a clear pattern. If your auto-bidder can capture as much value as on the 9th of June, I’d be pretty impressed!
While simplified analysis is inevitable in the NEM, this example only shows the importance of staying conscious of the limitations they carry, and to keep a critical eye on the results.
About our Guest Author
 |
Philippe Orhan is a Project Manager at Neoen Australia.
You can find Philippe on LinkedIn here. |


Be the first to comment on "Data Intensity of operating in the NEM, and implications for algorithmic bidding"