A quick note of thanks for those who have taken the time to remind me that summer 2013-14 has been and gone some weeks ago (in relation to our “Best Demand Forecaster in the NEM” competition for another year).
This summer was a reasonably volatile one (especially in the Queensland region, and in South Australia and Victoria to a lesser extent), and one where (because of the heatwave we endured) the demand did climb to levels not seen for a number of years. For this, and other reasons, we’ve been heavily occupied – so please accept our apologies for the delay in posting this summary.
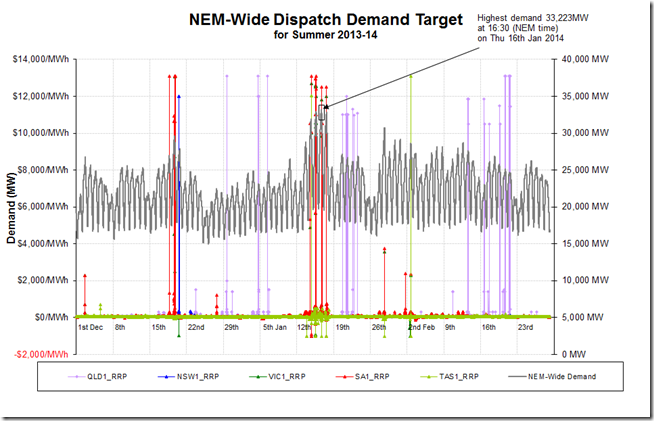
The following chart has been prepared (with 5-minute dispatch data extracted from ez2view) to summarise what happened:
In particular, we see some of the following as highlights of what happened over summer:
| Monday 2nd December 2013 | The chart above shows some price excursions in South Australia (with Victoria behind) on the first working day of summer – as discussed here. |
| mid-December | A burst of hot weather drove demand higher in SA on Wednesday 18th then VIC on Thursday 19th and NSW on Friday 20th December.
However, as shown above, the demand did even reach 30,000MW during that time. |
| early January 2014 | We noted about a burst of heat that drove demand in QLD to a new Saturday record on 4th January – but, once again, the very mild weather in the southern regions meant that the NEM-wide demand was very low. |
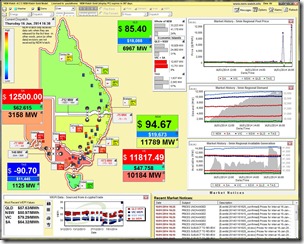
| mid January | We made several posts about the hot weather in the south that drove demand in VIC close to the all-time record in the middle of January: (a) High demand predicted the week before in PASA; (b) By Tuesday 14th the NEM-wide demand was pressing 32,000MW – with the VIC demand above 10,000MW; (c) On Wednesday 15th the heat-induced demand peak was forecast to be such that the AEMO issued a Lack of Reserve Notice for the Victorian region. A peak demand in VIC that day was close to the record. (d) On Thursday 16th the supply/demand balance was again stretched, but not to the same extent as the previous day, partly because of the return to service of Loy Yang A3. This contributed to the peak NEM-wide demand this summer being 33,223MW at 16:30 on Thursday 16th January. Here’s how it looked in NEM-Watch at the time:
We also posted afterwards about the extent to which demand response was amongst the factors that contributed to the peak being lower than it might have otherwise been. |
| Tuesday 28th January | We see in the chart above that the NEM-wide demand rose above 30,000MW on just one more occasion over summer – on Tuesday 28th January.
On this occasion we see that higher wind output helped to suppress the dispatch demand target used for our competition (along with being used to dispatch the NEM). |
| Thursday 20th and Friday 21st February 2014 | The chart above shows a number of price spikes that occurred in the QLD region late in February.
One of our Demand Side Response customers contacted us to enquire whether the prices they were seeing were actually real, or just spurious data – as this was likely to be an unvoiced question with a number of our other readers, we posted these notes here pertaining to the volatility in QLD (partly a result of the higher demand in QLD noted here). If anyone is interested in understanding more, please give us a call on +61 7 3368 4064 |


Leave a comment