I have been asked a couple of times recently, by new entrants to the NEM, about the impact of the drought in 2007 on generation levels around the NEM.
This prompted me to look at what we had posted previously on WattClarity®. Whilst we had previously commented in passing about the drought in a couple of articles (see here), I found that we had not actually posted a specific article on the topic.
Rather than continue to repeat the story, one-on-one with clients, it seemed that it would be more efficient to make this post. Hence, better late than never, here are some charts that provide some background:
1) Snowy hydro system
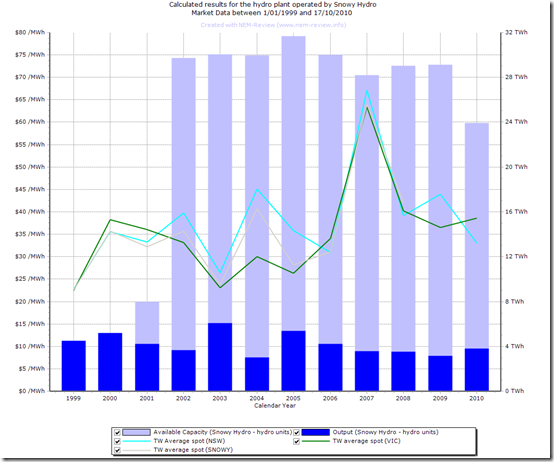
By virtue of its capacity, and its physical location in the NEM, the Snowy system has a large impact on price outcomes in the NEM.
The following chart (generated in NEM-Review 6) provides a view of how the output of the Snowy plant had dropped from 2005 to 2006, and then again into 2007.
The impact of the drought can be seen in the average prices shown for the regions or NSW, VIC – and also for SNOWY (until it was abolished as a region on 1st July 2008).
(Note in this chart, and others in this series, that the available generation data was first published towards the end of 2001 – hence data is not available for a full year until 2002)
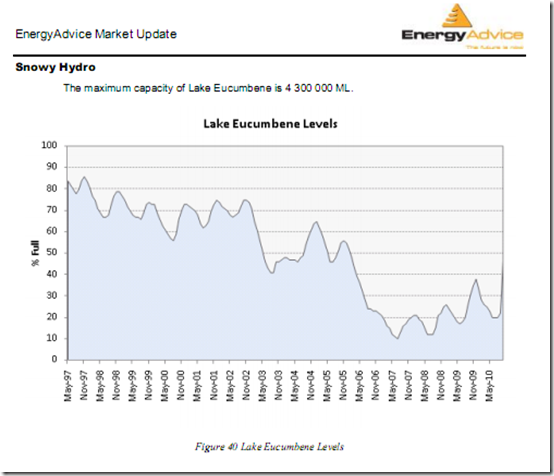
The following chart, taken from our jointly prepared “Energy Market Update” report for October 2010, highlights how dire the storage levels were in the main reservoir supplying the Snowy system:
The story was similar across the country.
2) Tasmanian hydro system
The other major hydro system in the NEM is the one in Tasmania.
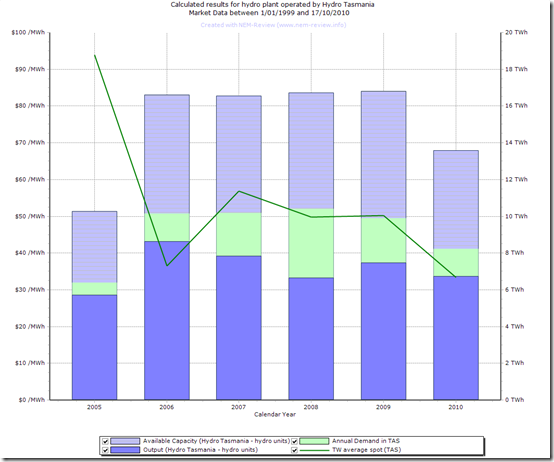
The following is a chart highlighting a similar situation in for all of the hydro capacity across Tasmania:
Given that the hydro plant output supplies the bulk of demand in TAS, I have included on this chart the aggregate level of demand in TAS to highlight how significantly TAS relied on imports over Basslink in 2007 (plus an amount of gas-fired generation).
(Note in this chart that Tasmania only entered the market in mid-2005, hence there is not the same amount of data history provided)
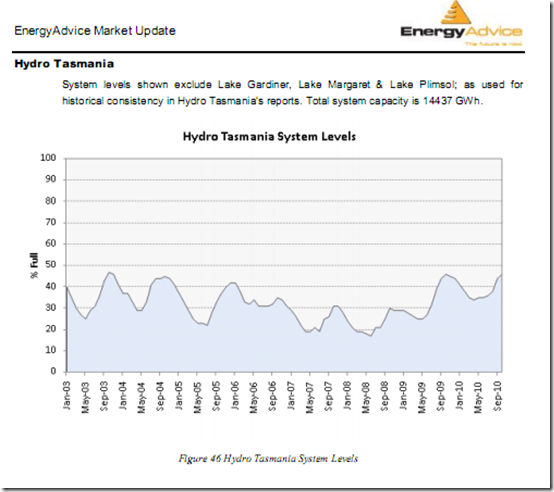
The following chart, also taken from our jointly prepared “Energy Market Update” report for October 2010, highlights storage levels in the Tasmanian hydro system:
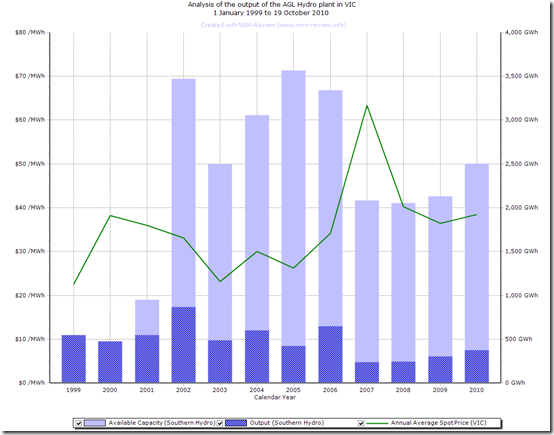
3) Southern Hydro system
Their is a smaller hydro system in the north-east of Victoria.
It was initially known as “Southern Hydro” and is currently owned by AGL, after a few changes in ownership in the past 10 years. The following chart highlights aggregate outputs from the scheme:
4) Wivenhoe Dam in QLD
However it was not just the hydro storage systems that were affected.
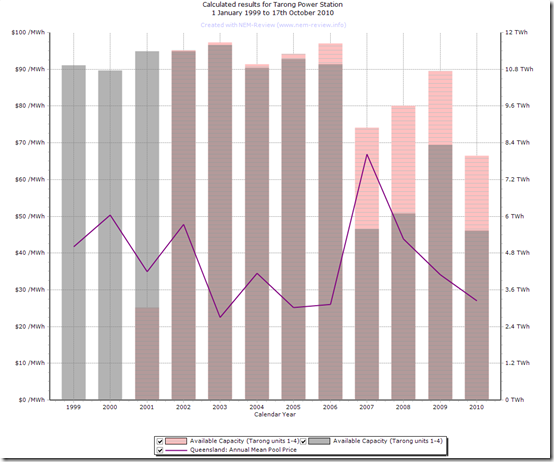
A number of thermal stations in QLD were significantly affected by the drought, as shown in the following charts. The first chart below shows the Tarong Power Station, located north-west of Brisbane:
As can be seen, the drought was a trigger for the Tarong station to radically alter its operational pattern – a change which persists till today.
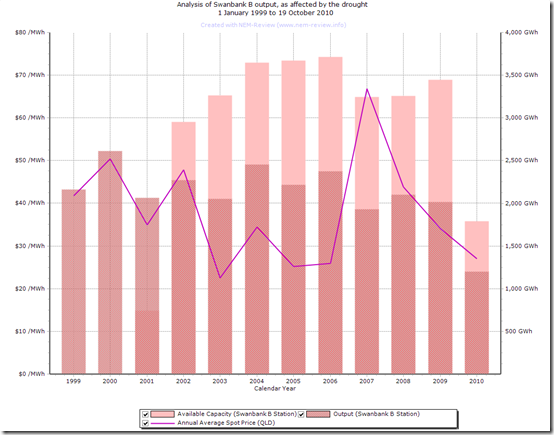
The second station shown is that of Swanbank B:
Similarly, the Swanbank B station was made to reduced load in order to conserve water.
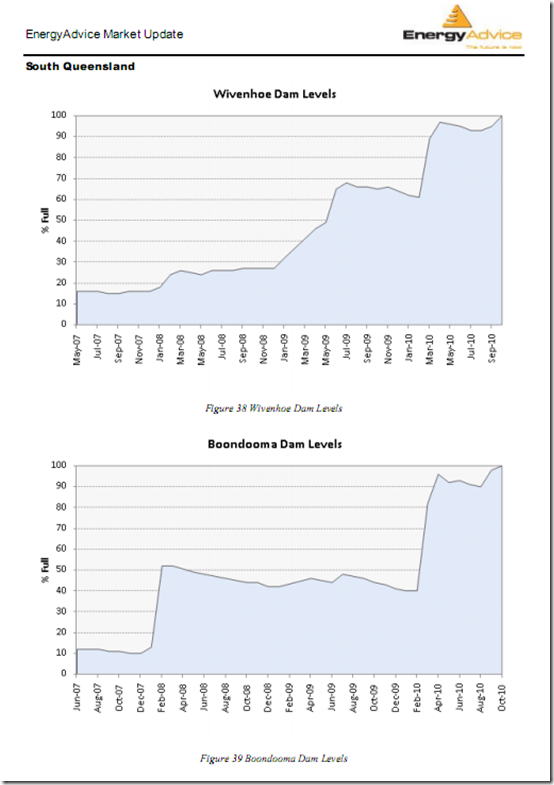
Key to the issue for both these stations was the fact that both were drawing cooling water from the Wivenhoe Dam, which also serves as the water source supplying a number of population centres, including Brisbane.
As can be seen below (again from the “Energy Market Update” report for October 2010) the situation was dire:
The second dam shown in this image (Boondooma) is smaller, and was built as the primary storage for Tarong Power Station – however its level was so low in 2007 that no water supplies could be obtained, meaning that Tarong reverted to Wivenhoe as the back-up.
When we can find some further time, we will look to post more about this…
| For those who wish to perform additional analysis with the data shown here, we have uploaded the .NRF file to this location.
Just download the linked file, unzip, and double-click to open in NEM-Review 6 – then enjoy! |
 |


Leave a comment