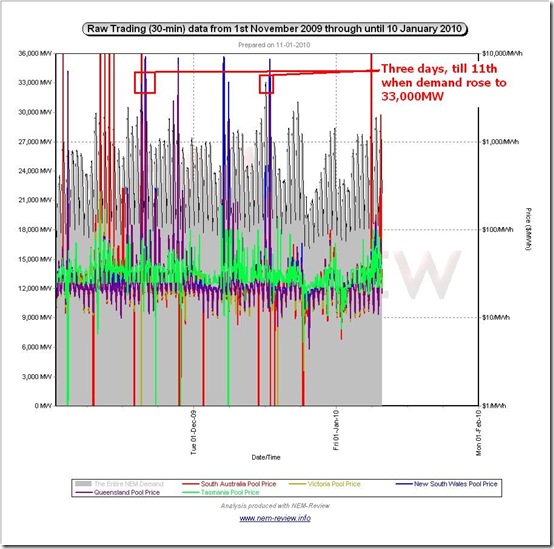
In the scheme of things, it’s been a fairly uneventful past 6 weeks or so, especially in comparison with the dramas that unfolded through November 2009. This can be seen here in the chart generated in NEM-Review.
As can be seen:
1) There was much more price volatility in the market during November than in December or January (to date).
2) On only 3 days did the NEM-wide demand rise to around 33,000MW:
(a) On Thursday 19th November, when the demand rose to a peak of 33,233MW on a trading target basis.
(b) On Friday 20th November, when the demand rose just lower, to a peak of 32,911MW on a trading target basis.
(c) On Wednesday 16th December, when the demand rose to a peak of 33,093MW on a trading target basis.
The summer sun has returned with full force to southern Australia over the past few days. SA is now officially suffering under a heatwave (which apparently is 5 consecutive days above 35 degrees Celcius) – not that this would have been news to anyone actually in the affected areas.
This has dragged demand higher again, along with prices.
.
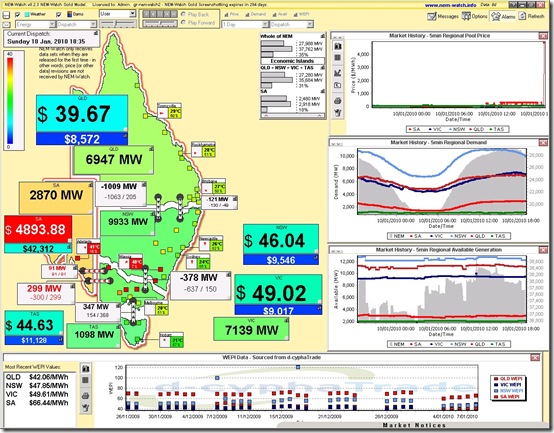
Yesterday Sunday 10th January 2010
We see in this single snapshot from NEM-Watch v8 that the temperatures were high in SA and other parts of southern Australia yesterday, leading to an impressive demand level in SA (2870MW at 18:35 NEM time) for a Sunday!
We note that temperatures remained high in Adelaide into the night (NEM-Watch showed it to be 36 degrees after 23:00)
.
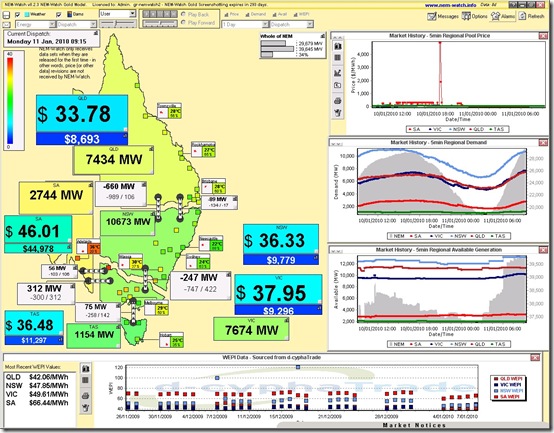
Today Monday 11th January 2010
Today, price spikes had been predicted by the AEMO in their pre-dispatch forecasts, and this did not disappoint.
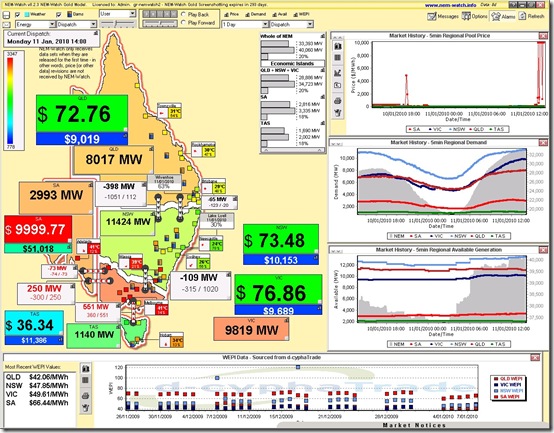
Our first snapshot (from 9:15 NEM time) above shows that temperatures were high early in the morning – with demand levels relatively elevated in SA (and also in QLD).
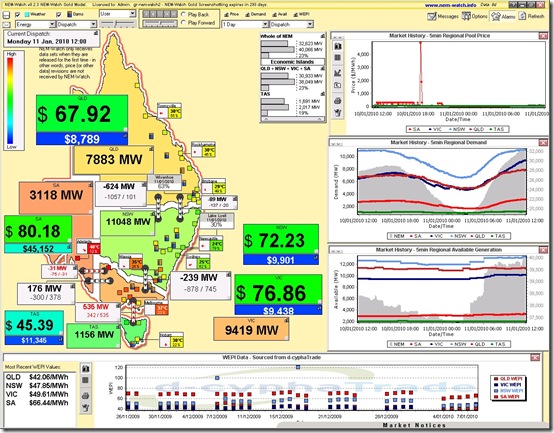
See below (at 12:00 noon) the demand in SA had climbed above 3000MW and above 9000MW in Victoria (whilst demand in QLD had barely moved).
At 14:00 (below) we see the prices had spiked in SA to be very close to VOLL. This price spike was supported by constraints on the interconnectors into SA, providing generators in SA local market power for this dispatch interval.
Note in particular with respect to the two snapshots above:
1) Between 12:00 and 14:00 demand in VIC had risen by 400MW (as would be expected as temperatures climbed)
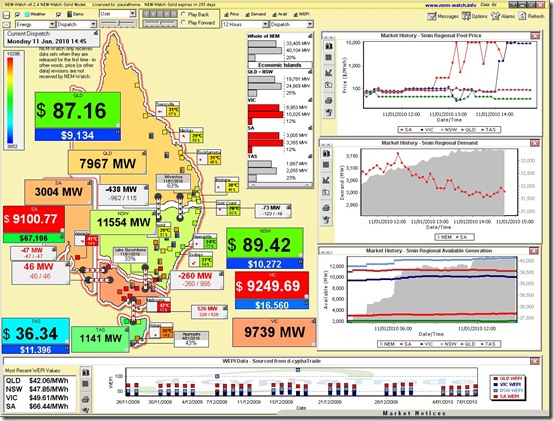
2) In contrast, over the same time period demand in SA had fallen by 123MW. Whilst some of this drop will have been due to the activation of some demand-side response at industrial sites in SA, it can be seen (below) that the demand began to trend downwards from 12:00 (i.e. even before the prices reached VOLL).
As can be seen in the above snapshot (from 14:45) spare generation capacities in both VIC (1062MW spare capacity available) and SA (350MW spare capacity available) are both being stretched. This is leading to low Instantaneous Reserve Plant Margin in the Economic Islands present in both of those regions.
This is certainly contributing to the high prices!
At the time of posting (15:21 NEM time) the story was much the same…


Be the first to comment on "Heatwave ramps up in southern Australia, dragging prices higher"