As it does every year, summer arrived in December with all the predictable accompaniments – including:
- high temperatures driving both high demand for electricity and (because of the underlying weather patterns) physical limitations on pretty much all pieces of the energy infrastructure chains (thermal plant, wind farms, solar PV, hydro, batteries, networks etc…); coupled with
- a healthy drive by market participants to earn their return for the year.
- In parallel, we’ve been been blessed with a plethora of sporting contests to keep us entertained over the long break, whilst we cogitate about the future;
- but (sadly) we’ve also seen a recurrence of shouting matches – and I’m not talking about with hot-headed tennis players, but rather the never-ending and inane “your technology solution is not as good as mine” arguments.
On the transition to 1st January 2018, I did make a New Year’s Wish that we might see more objective, rational thought about the vexed challenges facing us in this multi-faceted energy transition (knowing full well that the range of Villains lined up against us makes it quite improbable that this can be achieved in any form of optimal way).
However some very blinkered commentary I have seen from Thursday last week leads me to be even more despondent that we have the maturity to manage our way through this – so much so that I am reminded to pen a note flagging that those at the Extremes of the Emotion-o-meter are Villain #3 in their own right.
One of our guest authors, Allan O’Neil, has made a great start today by highlighting earlier some of the factors contributing to the high priced outcomes seen last Thursday and Friday (noting as well the important distinction between a tight supply/demand balance, which we expect to see from time to time, and a “lights are about to go out” calamity).
I don’t have much time to explore further (in part because the system largely worked as intended (i.e. as a sum-of-parts), so to some extent this is “much ado about nothing”), but just wanted to flag a couple other things I would want to explore further to provide a fully objective view of what happened last week:
1) Let’s look at how weather patterns affected all the technology options
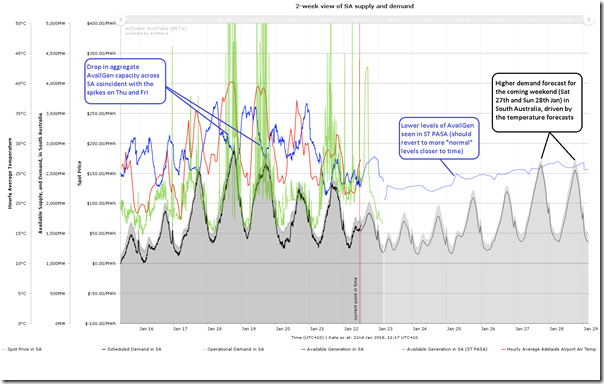
On Monday morning I saw some comments on social media expressing concerns for this weekend in South Australia when the temperature is forecast to have climbed again – hence I opened this trend for the South Australian region in the ez2view Time-Series Data Viewer (licensed users can see a live update for this trend here):
Having quickly seen (as expected) that demand (both Scheduled and Operational) are forecast to be higher, but not extreme on the weekend, my eye was magnetically drawn to the historical side, and the strong inverse correlation between the blue line and the green line, with:
- Blue line = aggregate Available Generation across all registered generators in South Australia (no matter what technology type); and
- Green line = 5-minute dispatch price in South Australia in a historical basis.
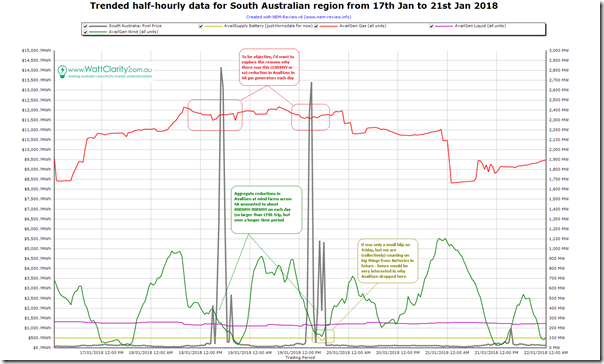
With a significant portion of the Australian Energy Twitterverse clearly highlighting the role of a 500MW-odd drop in available generation capacity in Victoria as a result of the Loy Yang B trip (and being the inquisitive data junkie that I am), I powered up the older NEM-Review v6 software for a change to explore more disaggregated data for South Australia. The following chart has resulted:
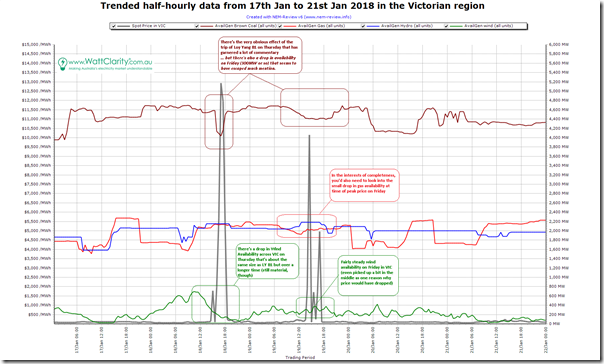
Because it did not take much time, I also threw together the same view for Victoria:
As highlighted in the two charts, there are clearly multiple factors combining to contribute to the price outcomes over both days. Here’s some for starters keeping in mind that these charts look only at available capacity:
1a) Unit trip at Loy Yang B Unit 1 (approx 520MW reduction)
Many others have commented on this, and the effect of the trip is obvious.
Yes, the trip had a big effect on the prices seen on Thursday – but, no, it was not the only factor at work. The fact that prices were also up on Friday should be a pretty big give-away that it was more than just a unit trip that contributed to the high prices. Anyone who does not acknowledge that there were a number of significant factors is:
- analytically incompetent (especially when it comes to the complexities of an interconnected complex system); or
- using emotion rather than logic, or
- deliberately misleading you.
A key question I have that I have not seen any answer to is “What caused the trip?”. Clearly (as the unit was back online in a relatively short space of time) it was not some catastrophic major plant “failure” (a much overused term), but I am particularly interested to know:
- whether the heat actually played a role in some way (as distinct from the assumptions that seem to being made by others because of coincidence); and
- I am also keenly interested to understand if there are some impacts of changes in operating regimes and maintenance practices I posted about back in 2014 and which seems to be the underlying assumption between the Australia Institute’s “outage watch” service. Given that the unit was back online quickly, I suspect not in this case. However it is a very important question still to explore (before jumping to too many conclusions, I might add).
1b) Aggregate Brown Coal availability drop in VIC on Friday (300MW reduction)
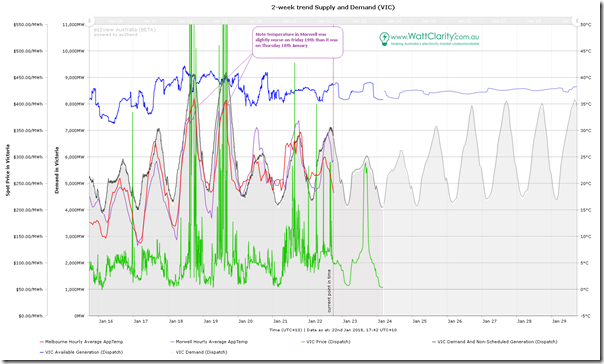
Friday saw fairly similar temperatures in Victoria (at least in Melbourne), as noted in the same sort of trended chart for Victoria from the ez2view Time Series Data Viewer (which clients can access here in a live updating format):
We know that ambient temperature affects the maximum capabilities of thermal generators (refer the “Carnot cycle” if you don’t know why). Hence we wonder if the somewhat higher temperatures on Friday in Morwell (i.e. Latrobe Valley airport) were enough to lead to some slight de-rating of the capacity of some coal units noted in the NEM-Review chart for Victoria. No time to check, at the present moment, but important.
1c) Aggregate availability of wind also significantly affected (down 1,500MW on Thursday, and down “only” 800MW on Friday from a lower base)
Another group of commentators (notably including our Federal Minister who should be responsible for providing leadership in guiding this energy transition (not that he’s the only politician falling short of my expectations)) have latched onto the very material drop in wind availability across Victoria and South Australia on both Thursday and Friday.
Yes, the significant drop in wind availability across Victoria and South Australia had a big effect on the prices seen on both Thursday and Friday – but, no, it was not the only factor at work. In the same way I noted above, anyone who does not acknowledge that there were a number of significant factors is:
- analytically incompetent (especially when it comes to the complexities of an interconnected complex system); or
- using emotion rather than logic, or
- deliberately misleading you.
The fact that we have 2 separate groups of people, each obsessively focusing on one particular contributing factor (seemingly to the exclusion of all others) is quite bizarre – and not helpful, in terms of helping with this energy transition.
1d) Slight reductions in available generation at gas-fired plant
We saw above (1b) that there was a reduction in available capacity across Victoria’s brown coal fleet most noticeably on Friday. There were also reductions in the available capacity of gas-fired generation in SA and VIC, but this does not seem to be to the same extent. Still well worth further analysis, though.
1e) A drop in availability at the Hornsdale battery on Friday
Also highlighted in the chart above is a drop in the availability of the battery on Friday. Whilst this does not seem large enough to have had any material effect on market outcomes last week, it is well worth further investigation given that we’re going to be increasingly counting on battery storage in the years ahead.
We know, for instance, that batteries are generally affected by high temperatures – but have no understanding of what played a role in the small drop in capability shown last Friday.
1f) Effects of network outages and trips
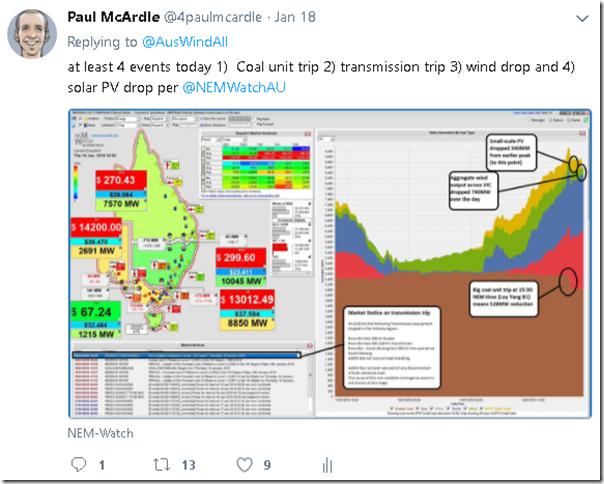
In a snapshot from NEM-Watch v10 that I posted on Thursday to highlight that it was more than one factor involved, I flagged the trip of a transmission line within Victoria:
The AEMO Market Notice read:
“Non-credible contingency event – VIC region – Thursday, 18 January 2018
At 1519 hrs the following Transmission equipment tripped in the Victoria region.
Rowville No2 500 kV Busbar
Rowville No2 500 /220 kV Transformer
Rowville – South Morang No3 500 kV line opened at South Morang
AEMO did not instruct load shedding.AEMO has not been advised of any disconnection of bulk electrical load.
The cause of this non credible contingency event is not known at this stage.”
Somewhat confusingly, the market notice was published at 16:20 NEM time, which would be 61 minutes after the trip if the time noted in the notice was correct. It would also be 10 minutes or so before the trip of the Loy Yang B unit 1. I have not had time to dig any further than that.
We know that transmission system configurations (and outages – planned and unplanned) can have significant impacts on market outcomes. If time permitted, it would be worth exploring this further.
1g) Other considerations with supply-side infrastructure
No doubt there are others, in addition to those noted above.
2) Let’s also look at how the Supply-side behaved
In his article on Monday, Allan highlighted some bidding behaviour by AGL at Torrens, and also noted how Alinta (as new owners of Loy Yang B) could probably have been hurt by the unexpected loss of capacity at a time of such volatility. There are more than two supply-side participants in this market, hence an objective analysis would delve into how all of the various participants had behaved in offering their capacity to the market.
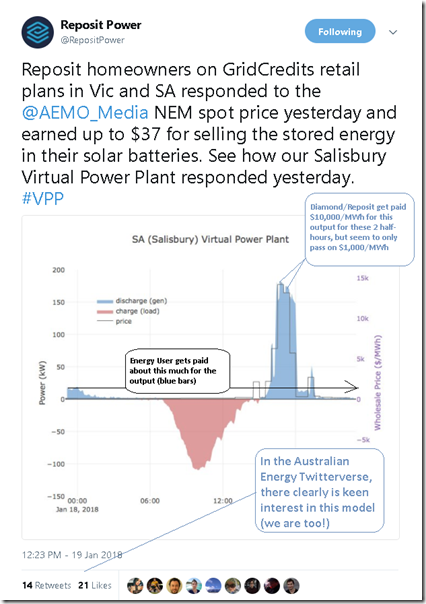
Note that (to be objective, and also because we expect to see significant growth in these types of approaches as the energy transition continues) we would need to extend this analysis even down to the smaller participants in the market, ensuring that (wherever possible) the similar standards of analysis applied. For instance, I saw a number of popular tweets from the guys at energy-sector start-up Reposit talking about the cash their clients received from assisting at times of peak pricing.
Wanting to learn more about how this program actually works, I landed on this page by their retail partner, Diamond Energy, noting that the customer would receive “Grid Credits” to the tune of $1/kWh for energy pumped back into the grid from a Reposit-controlled (and presumably Diamond-triggered) battery on the customer’s premises. Note, however, that the customer gets $1/kWh (or $1,000/MWh) whereas the spot price spiked to over $10,000/MWh on a couple of occasions:
There’s clearly a big gap!
Now running a software company in the energy sector myself I am well aware of the challenges of meeting significant fixed costs in a business, and the way different business models can be used in order to deliver this. At first glance I think Reposit and Diamond Energy have very valid reasons to “only” share 10% of the benefit they gain from exporting from “captive” batteries during the super-peak prices.
I highlight this example, however, to (hopefully) give some readers a moment to pause and wonder how this story might be reported if the company posting the tweet was one of the big, bad, gentailers – in which case I’d almost guarantee that there would be articles written about “Greedy Energy Company steals 90% of the benefits of residential energy user’s exports”.
- As it is, Reposit is congratulated by many for persevering with the development of a business model that provides some benefit to the residential energy user at the same time of assisting in managing the supply/demand balance. I am with those who congratulate them.
- At the same time, however, I also look forward to the day where other competitors step in and find other ways to share more of the benefits with the residential energy users. That’s what a competitive market should deliver (something which seems to be under some threat in some corners).
I’m sure than an objective review of participant behaviour over this period would yield worthwhile observations relevant to this ongoing energy transition.
3) Let’s look at how the Demand Side operated
It takes two hands to clap – and, likewise, the operation of the demand side (both what we do as consumers, and what we don’t do) is very important in delivering the outcomes we see in the wholesale market, and thereon into the retail market.
In Allan’s earlier analysis on Monday, he combined demand in Victoria and South Australia to illustrate that the demand level was reasonably high (for this summer) but still a fair way below the historical peaks experienced in prior summers. These high demand levels clearly have an impact on the price outcomes achieved.
We know that NEM-wide demand was higher on Friday than on Thursday.
Just as the actual demand levels are important in the price levels achieved, so too are expectations of demand levels – as this is what many stakeholders respond to in making capacity available (or putting other measures in place) for the day.
I’ve noted before about how I am very sympathetic of those whose responsibility it is to produce the forecasts that must be integral to the way supply & demand is balanced (and the market operates efficiently). The difficulties are due, at least in part, to the fact that any model’s just a model, it’s not reality. Yet we need them all the same.
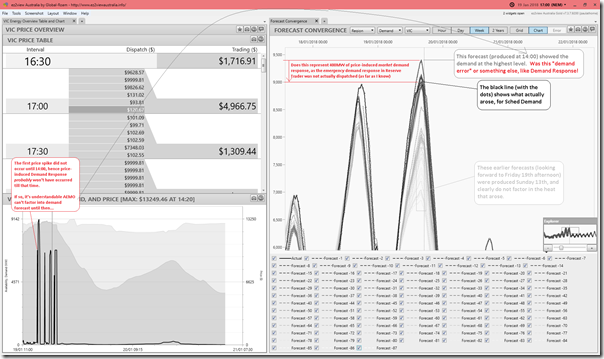
With the “Forecast Convergence” widget in ez2view, we have the ability to look at how each of AEMO’s successive forecasts for a range of variables converged onto ‘reality’ (i.e. what actually turned out happening). The following image has been captured focused on Scheduled Demand in Victoria, time-travelled back to 17:00 on Friday 19th January (i.e. just towards the end of the volatile period):
As highlighted on the chart, we see early forecasts (a week ahead) for Friday grossly underestimated what the demand would be, but forecasts closer to the date correctly factored in the heat. Indeed, the forecast run at 10:00 on the day saw the demand peak forecast for 16:00 step up considerably, but then back down after the 14:00 forecast run. As noted on the chart, the first major price spike was in the 14:00 dispatch interval – this would have presumably triggered a fair amount of price-enabled market demand response (though the exact amount is impossible for anyone to truly know). We hypothesise that it would only be at this point that AEMO would be able to factor the DR into the demand forecast (given it is an outcome from the price discovery process for a DI, not an input).
This seems to be a worthwhile note of caution to seeing everything through the prism of “demand forecast error”.
What I did not note for the demand shape on Thursday (though it is very visible), was that the actual demand seemed to run longer than forecast (i.e. like a heat stuck around later that day, or for some other reason).
There’s plenty more we could analyse in order to gain a truly objective view of what actually happened on Thursday and Friday last week. However I have run out of time, and really do need to get back to some particular client commitments tomorrow.
There are clearly a number of different (and interrelated) factors at play. As noted above, anyone purporting to say that it’s all due to one particular factor (trip of Loy Yang B1, lack of wind, or something else) should be treated with a healthy dose of scepticism.


Wouldn’t the reason for the drop in GT capacity be purely the temperature function? As the air gets warmer, you get less mass flow through a unit so the MW go down? For CCGTs, the MW would drop as the circulating water temperature for the steam turbine condenser went up
Hi Paul, great article. I work for Reposit Power and I would like to mention that Reposit takes no cut of the GridCredits earned during a market event like this. We charge retail partners fixed fees so there are no perverse incentives.
The $1/kWh is set by retailers and we are actively working with Retailers to introduce additional benefits. In a trial with one retailer we already offer the customer the full spot price which is how some customers were able to earn up to $37 in a single day just by trading excess solar. We are also looking at other incentives such as reducing the daily access cost to add benefit year-round.
It’s also worth noting in this arrangement that the customer takes no risk – the $1/kWh is paid to the customer regardless how the 30 minute period settles. For example, if the 30 minute period settled at less that $1000/MWh then the customer would still earn their $1/kWh if they were called upon during this time. Due to this risk I imagine we will always see some difference in what the consumer earns in these events vs the spot price.
Reposit is working to empower consumers on the grid and compensate them accordingly. Whilst is not full spot price it’s better than they can currently earn otherwise and it’s better than what they would otherwise buy for. Watch this space – increased incentives will be coming, it just takes some time.
Hey Paul
For the demand revision downwards on Friday, you’ll see that there was a “cool” change in VIC from 2:30pm local. Further AEMO also called ~140MW of RERT which had the impact of reducing scheduled demand (compare the demand_and_nonschedgen and dispatchableload in the intervention/what-if cases – there is no change to scheduled demand).
Just to clarify further for anyone puzzled like I was:
– data published in the “Intervention” case represents how the market was physically dispatched, including the effect of demand reductions in Victoria called by AEMO under its RERT arrangements
– in the “What-if?” case AEMO estimates how the market would have been dispatched without intervention. Crucially, this “what-if?” case sets the market prices.
– you might expect that in the “what-if?” case scheduled demands would be adjusted upwards by the amount of load reduction called under RERT – representing what demand would have been without intervention. In fact the way AEMO deals with this is to leave scheduled demand unchanged and represent the RERT reduction amounts as additional “dispatchable loads” – equivalent to demand from pumped hydro for example. This causes the amount of generation + imports required in the “what-if?” case to increase, just as it would if scheduled demand increased by the same amount.
– this approach also makes the RERT load reduction amounts more explicit in the dispatch data. As HR says, you can see reductions of up to 140-odd MW, averaging 69 MW across the period of intervention.
Hey Allan
Thanks for a fuller explanation.
Not sure if I agree with you about scheduled demand though. There is no what-if scheduled demand – it seems to me that for the duration of intervention AEMO considers the curtailed load of reserve traders is shifted from scheduled demand to dispatchable load – in the what-if case the reserve trader would have continued to consume (and thus there would be a dispatchable load for that period), and the intervention constrains them off.
I never was the greatest at the seemingly infinite definitions of demand… But you’ll see that there is a what-if demand_and_nonsched (which I consider to be the demand required to be served by transmission connected generation).
Btw you owe me for Pony Club 😉
Silly me I think we’re talking about the same thing – I didn’t quite process your comment about AEMO “leav[ing] scheduled demand unchanged” correctly.
Yep we’re in furious agreement about this. Demand_and_nonschedgen includes the demand of dispatchable loads, whereas most AEMO definitions of “demand” exclude the dispatchable load component.
Pony Club?? – You’re confusing me with another Allan O’Neil I think.
Hi Paul,
Thanks for your articles, I find them all extremely interesting and am amazed how complex the supply and demand issues become.
I am also amazed at the costs involved. Those 2 hot days in SA cost $68M and $60M respectively compared to the usual daily $1.5M to $4M.
This makes the suggested $400M spent on the SA 250MW of diesel generators look cheap.
I can not understand why the generators were not used on 19th.
I estimate if they were used for 7 hours (11-18:00) they would have generated 1.4GWh and saved the state about $4.5M.
Dave
—————
Assumptions:
Cost of power to state from 11-18:00
————————————————–
250MW generators working at 80% (heat impaired) for 11:00-18:00 hours 1400MWh
Average RRP 11:00-18:00: $807000/hour. 7 hours: Total $5.6M.
Obviously the extra 200MWh would reduced the RRP but that is still an actually saving by the state.
Generation Costs:
————————
200MW generator uses 80K litres diesel/hour at $1.75/litre cost for 7 hours: $980K.
Dave,
I think the purpose of the generators is to prevent blackouts, not to reduce prices and they are probably prevented from generating until just before an LOR3 event i.e. load shedding. if they were dispatched before this they would be interfering with the market and would upset the big boys making their killings on the hot days. You could say the heat would cause blackouts which would cause political heat and that is what they are designed to prevent; price is another matter. Sorry for the cynicism.
Hey Paul. Thanks as always. Any chance you could make it shorter – i would love to read this stuff but time is tight? Maybe take as read your frustration with the superficiality of popular commentary, and jump to the gist of your analysis.
AGL says not heat related
“But AGL’s director of operations Doug Jackson said the issues at Loy Yang A were unrelated to the summer heat but were driven by “not uncommon” problems that arose while restarting a unit after a major overhaul to ready it for peak summer demand.”
http://www.afr.com/business/mining/coal/coal-power-producers-defend-record-after-heavy-spending-20180123-h0nbsh
Thanks Rob
… but that was for Loy Yang A. it was Loy Yang B that tripped on Thursday last week – in which case the quote you wanted from the AFR article was:
“Alinta, which earlier this month completed the acquisition of Loy Yang B for about $1.2 billion, said an unexpected trip of one unit on January 18 was rectified and the plant supplied critical energy into the market during the hot spell last weekend.”
Does not explain why the trip, though!
Surely the extra trips of coal plants are due to the fact that the deeper the penetration of intermittents into the NEM…the more coal plants are relegated …by the artificial favoring of intermittents in the merit order for dispatch..coal plants .made to operate outside the baseload mode they’re designed for…as MIT and others have reported.
The extra cycling and ramp-ups damage coal plants and make them less efficient…causing them to need more frequent maintenance…which generators are no doubt reluctant to pay for with their plants on death row anyway.
AEMC has also said that intermittents damage the grid..increasingly as they penetrate further into the market.
The wind and solar enthusiasts are deliberately trying to make Australians believe that all these years COAL has been an unreliable power source when that’s not true.
They MUST KNOW that the system that gives an artificial advantage to intermittents causes coal plants and the grid to be damaged .
Why are they allowed to deliberately deceive the Australian people?
So much deceit on the RE side!