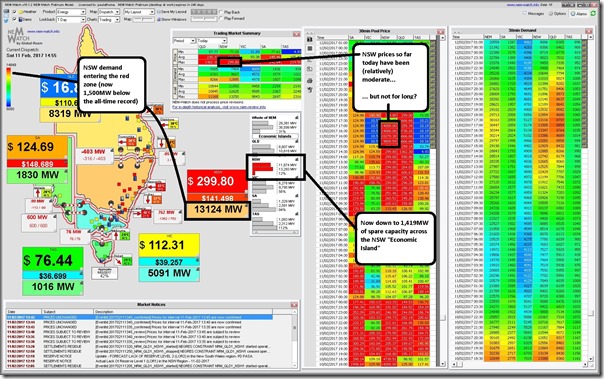
Following my first post at 12:25 NEM time we see that demand has continued to climb in NSW as the heatwave continues, and as shown in the following snapshot from NEM-Watch at 14:55 NEM time (so 15:55 Market Time):
As noted, demand is climbing up into the red zone today.
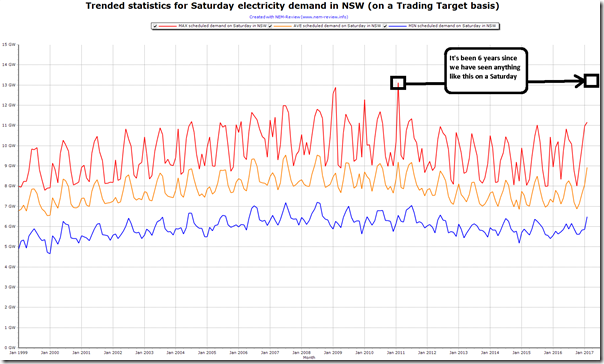
Because of a question asked on twitter about today’s earlier post, I have powered up NEM-Review v6 to run this longer-term query of the maximum demand levels seen in NSW over all Saturdays since January 1999 – producing the following trend:
As is clear from this trend, it’s been 6 years since we have seen anything like this level of peak demand – which (as others have noted) should have been expected at some point (given ongoing population growth, etc) but is still noteworthy given the list of factors that had been working to suppress demand over the interim period.
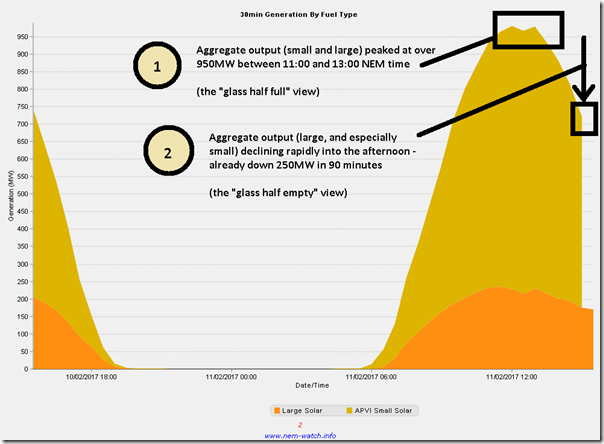
Of particular interest to many, we know, is how solar PV is contributing – hence I’ve extracted this current chart from NEM-Watch highlighting both small-scale rooftop PV (estimated aggregate data from the APVI) and metered data for large-scale plant.
For us, this chart really sums up the “glass half-empty, glass half-full” conundrum relating to solar PV and peak demand, especially on days like today. Worth highlighting the much more rapid decline in small-scale solar output (aggregated across NSW) compared to the few large scale plant, which seem to be much better at holding output high for longer. Perhaps one of our learned readers can provide a comment below to help me understand why?
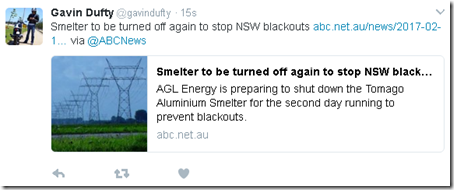
As could be (quite sadly) predicted, I see our friends at Tomago Aluminium smelter are going to be asked to turn down consumption, as they did yesterday to contribute to the effort of avoiding more wide-spread load shedding (or unstable system collapse). I’m sure a pretty unwanted, and unwelcome, form of demand response (but, by the magnitude of the reduction reported, indicative of the huge size of the crisis that the energy supply sector finds itself in).
Here’s the article at the ABC linked in the tweet above, and here is coverage on the Age.
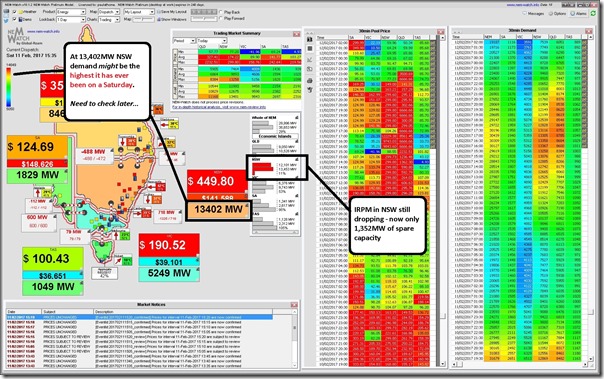
With the time taken to put this post together, the demand is now up to 13,4xxMW in NSW as shown in this NEM-Watch snapshot at 15:35 NEM time:


Hey Paul – thanks for the update. In regards to Solar data – am sure you though about this – do the timezones of the APVI data line up with NEM-time? It also seems a bit strange the small scale capacity seems to line come online an hour or so (ish) earlier..
Cheers, Mick
Good point, Mick
Will investigate.
This data here is all from the AEMO, so definitely all NEM time:
https://wattclarity.com.au/2017/02/about-solar-panels-predominantly-facing-north-not-west/
With respect to APVI, I can’t remember off-hand what the time-stamps are, but would think that we would have addressed this and translated to NEM time. But will check with the team.
Paul
Hi Paul
really big guess here, but could the more rapid decline in small scale solar be because its predominantly roof top mounting which may be more prone to afternoon shading from neighboring homes and trees, which large scale solar may not?
I think that would certainly be a contributing factor.
Another thing to take into account is the three major large scale solar PV sites in NSW are spread out geographically east to west (Moree, Nyngan and Broken Hill) compared to small scale rooftop PV (heavily concentrated on the east coast) so generation is more evenly distributed. This also helps explain the later start time for generation for large scale PV as Moree is the furthest east yet still 400km from the coast. The Moree solar power station is also single axis tracking which has a smoother output curve over the day than fixed position installations.
And as another reader noted, Nyngen and Moree large scale solar farms are tracking which extends morning and afternoon production….