On Tuesday we noted that Ketan had shared a post originally made on Thursday 25th February about some high demand experienced in NSW (well, moderately high, being highest experienced through traditional summer – but still well below the all-time maximum as noted in the article):
Ketan found our article after completing his own analysis here.
Seeing the reference reminded me that I’d promised to add a bit more to my WattClarity post, but had been distracted by a number of other things over the ensuing 2-week period (for which I apologise).
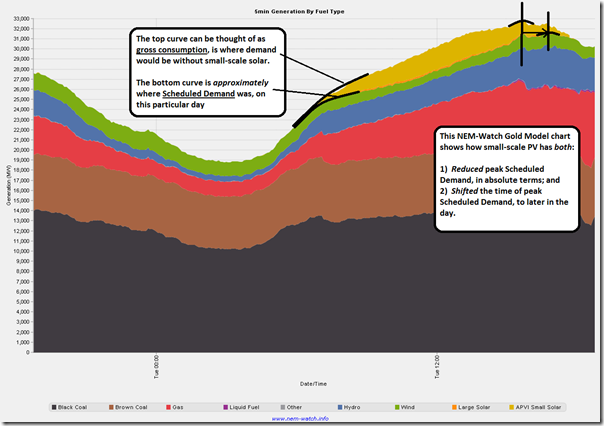
I don’t have much time today, but did want to add in this snapshot taken from NEM-Watch yesterday evening, which shows a stacked & trended generation-by-fuel-type chart across the whole of the NEM:
(a) so the same data as shown in the NEM-Watch Widget on RenewEconomy, but just trended over a 24 hour period;
(b) I’d like to show you more history but our agreement with the APVI currently allows us to only display 24 hours of history in the installed NEM-Watch product.
I’ve annotated the chart to highlight the trend of demand both with, and without, small-scale solar PV. As an approximation, we can subtract small-scale PV output off gross consumption (AEMO calls this Native Demand) to produce the remainder, Scheduled Demand (i.e. what AEMO dispatches to, to keep the lights on):
As highlighted in this chart, solar PV has had two effects on peak demand on this particular day:
1) Solar PV has reduced the peak Scheduled Demand below what it would have otherwise been; and
2) Solar PV has also shifted the time of peak Scheduled Demand to later in the day.
From what I have seen, these two effects are fairly typical with reference to a summer demand shape (the winter demand shape has been evening peaking for as long as I have been watching, hence is a different beast entirely).
What this implies is that there’s a law of diminishing returns at play here – whilst a certain number of MW of installed capacity of solar PV (to date) has reduced peak demand by some amount, doubling that capacity (all else being equal) would result in less than a doubling of the reduction in peak demand. This is because solar PV output tails off rapidly through the afternoon (especially if new panels continue to be installed facing north).
There would come a point (though we’re not there yet on the particular day shown) when peak demand is shifted outside of daylight hours and, if so, more solar will do nothing – in the absence of some form of load-shifting – to further reduce peak demand. Part of “the Duck Curve” issue.
Hence caution should be adopted when using (simplistic) “rules of thumb” – like assuming that more of the same will provide a linearly increasing value in terms of peak demand reduction.


The effect you seem to have missed as a discrete element in the equation, I believe, is the increase in the rate of change of dispatched generation required late in summer afternoons as the peak demand arrives and the solar input decreases meaning that scheduled generation is required to respond more quickly. I think this would be more apparent if you looked just at SA demand where there is less industrial electrical load as a percentage, due to gas substitution, and the high impact in SA of air-conditioning demand which rises trailing the temperature increases. This means that late in the afternoon the demand rises more quickly as solar output falls away. Fortunately in SA we have relatively flexible generators due to the high penetration of CCGTs, OCGTs and even our gas fired steam generators are relatively flexible compared to large coal fired base-load generators. The Vic-SA interconnector also has a major effect but fortunately, due to the relatively small import required, does not tax the rate of change of interstate coal-fired generators.
In winter of course any solar generation will be all gone by late afternoon having reduced the output of the scheduled generation to a minimum or even to shut-down in early afternoon and then the evening peak will be entirely filled by scheduled generation and possibly wind. This will really test responsiveness and once NPS is OOS show the value of CCGTs.
Thanks for pointing this out, Shane
The increased rate-of-change was something that I looked at here:
https://wattclarity.com.au/2015/10/ramp-rates-for-unserved-demand-much-higher-in-this-future-world/
I understand it’s causing some head scratching for a number of people – such as what it might mean for frequency change and hence FCAS requirements.
Paul