[apologies, in advance, if there are errors here – produced under time constraints this afternoon]
Following my post on Wednesday, highlighting the overall change in bid patterns for generators across the NEM, we have been asked a few more questions (online and offline) about the extent to which this change in bidding behaviour has been seen in Queensland. Some of these questions follow on from observations of low prices in QLD – and even dips into negative territory.
Hence, as the next step in the process of unbundling bidding behaviour, here’s a quick skim through the same types of charts – but just filtered down to Queensland:
1) Bidding over the 2014 transition in Queensland
1a) Across the whole NEM
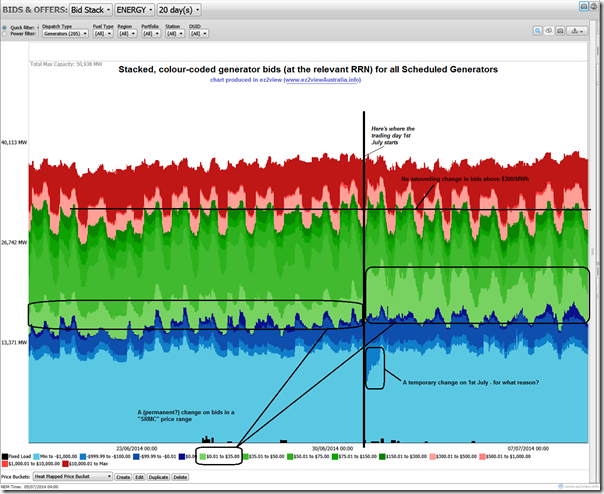
For ease of comparison, here’s the whole-of-the-NEM chart again (originally posted here):
1b) Filtered down to Queensland
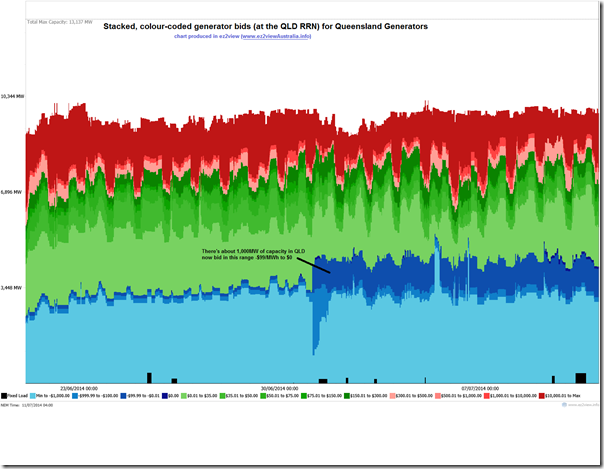
In the following chart from ez2view, again highlighting a recent 20-day pattern of bidding behaviour over the financial year transition (but this time filtered down to just generators in Queensland) we also see a shift in bidding behaviour observed from 1st July – but, in this case, it’s different for Queensland:
Compared with the “across the NEM” chart (above) there’s a less significant increase in bids in the range $0 to $35 (the light green area), whereas across the NEM before 30 June there was a more significant percentage of capacity bid in the $35 to $50 range.
For Queensland, what’s most notable is that there’s now about 1,000MW of capacity bid in the range –$99.99/MWh to $0/MWh at the Regional Reference node, whereas there was virtually nothing (in Queensland) bidding in this price range previously.
In running a few spot checks, capacity at Kogan Creek, Gladstone and Kareeya all seems to be being bid consistently at a dollar or less below zero.
1c) Looking just at Kogan Creek
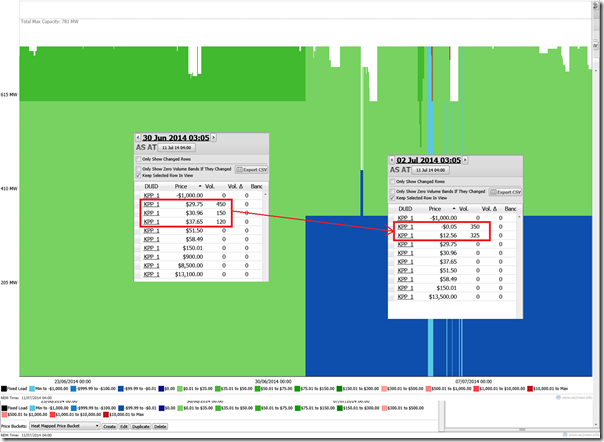
Picking on Kogan Creek and filtering further we see the following (much less colourful) trend:
ez2view provides the ability to view volume offered in each of the 10 daily bid bands for each individual dispatch interval. I’ve sampled two dispatch intervals straddling the financial year boundary, including the numbers superimposed on the chart above to highlight the change put in place at Kogan Creek.
As is shown in the two samples chosen (which are indicative of the general change) highlight how:
(a) In June, Kogan commonly bid in three tranches ($29.75/MWh, $30.96/MWh and $37.65/MWh); but
(b) Shifted this volume to 2 active tranches (–5c and $12.56/MWh) in July.
The numerically inclined amongst our readership will multiply out $24.15/tonne (2013-14) x 0.935tonne/MWh sent out (assumed for Kogan) x 0.92 MWh sent-out/MWh as generated = $20.7/MWh as-generated approximate carbon tax uplift on Kogan Creek operating cost.
Comparing the two sample bids above (no permutation of which will reveal a difference of exactly $20.7/MWh) highlights the difficulty anyone will face in trying to ascertain if generators have removed carbon pricing from their bids (apart from anything else, an exercise which would depend on assuming that all else should be the same, something which is just not true).
2) Questions
The following are amongst the questions we have been asked over the past week or so:
2a) The extent to which re-priced bidding, and solar, have contributed to the low prices in Queensland?
Since this post on 1st July, there has been particular interest in the extent to which solar production has been responsible – as distinct from the contribution of repriced capacity above.
This is a topic for another post – though I would note that there’s consistently been 1000MW more capacity bid below zero in Queensland since 1st July – whereas the contribution from solar PV, even at peak times (in the consistently sunny days we’ve seen the past couple weeks) has not yet been that large.
2b) Why the prices in QLD dropped below zero?
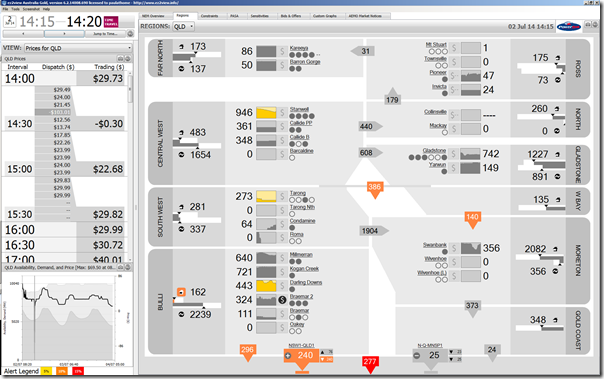
Since it was reported elsewhere (like here) that the spot price had dropped below zero in Queensland (a rare event) some have asked us questions as to why this happened.
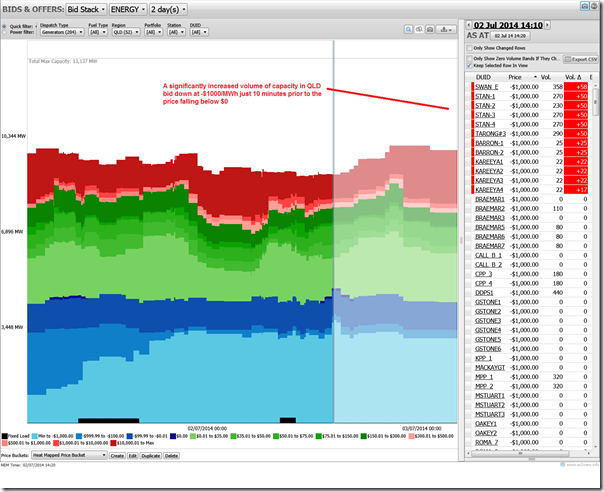
Above is a quick record of the event (14:20 on Wednesday 2nd July using “Time Travel” in ez2view) though I will have to return to that one later. All I have time to do just now is add in this view of filtered bids for QLD highlighting a large addition of capacity bid below zero only 10 minutes prior to the price drop:
Again, on first look it seems like bids are the main contributor.
2c) Who’s backed carbon out, and who has not?
I’ll have to return to that one later…
If you have other questions you’d like us to look into, please let us know…


Paul, have you taken into account that for most of the first week of July there has been a transmission outage constraining Qld-NSW flows on QNI?
Hi James
Thanks for highlighting one more factor. As noted above, there’s enough there for another post at some stage.
Paul
PS James
Have posted this chart here to illustrate your point.
Thanks
Paul