SMS alerts triggered by NEM-Watch alerted us to the fact, whilst out of the office, that the price was bouncing around in Victoria and South Australia yesterday.
Looking backwards from this morning we see that the extent to which prices bounced around yesterday in both regions – triggering what appears to be a significant amount of Demand Side Response in both regions:
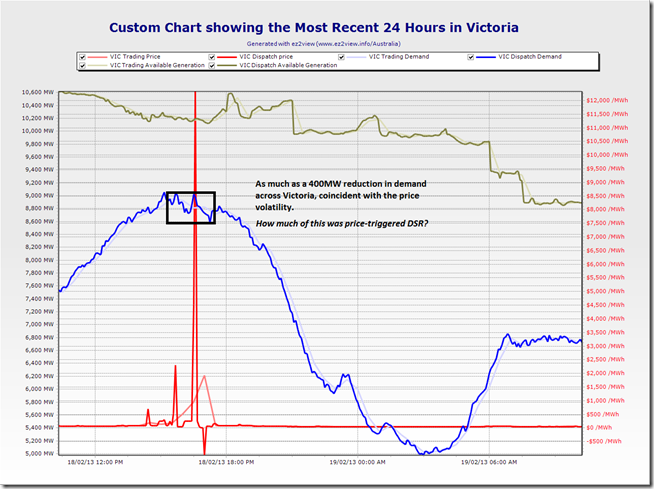
The custom chart for Victoria (from ez2view) shows what might be as much as 400MW of DSR on the day:
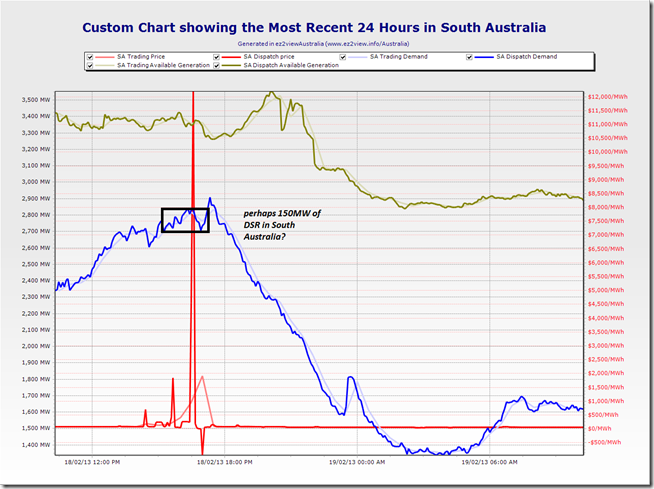
The custom chart for South Australia (from ez2view) shows what might be as much as 150MW of DSR:
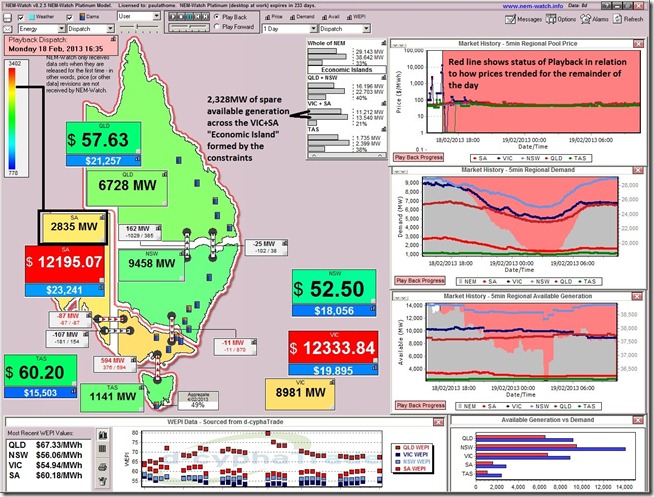
Rewinding to 16:35 on the previous day through Playback in NEM-Watch we can see that the demand in VIC and SA was relatively high (pushing towards the red zone) as a result of the higher temperatures experienced in those locations yesterday:


It is interesting that after the DSR in SA the load again peaked with no further pricing response.
Has DSR changed generator bidding behaviour??
I’ll be happy to answer this one for you, one-on-one, Peter!
Will call you in the next day or two – or call me 07 3368 4064 if a particular time suits.
Regards
Paul
SPAusnet also declared Monday 18 February 3pm to 7pm as a critical peak demand day, so this could have been a contributing factor.
Hi Mohsin
Thanks for this note, as well – yes, it would probably have had some effect.
SP Ausnet notes here that:
1) they expect the reduction in peak demand to be approximately 3-4% of their (distribution area) maximum demand – hence perhaps as much as 200MW.
2) Given that this DSR would have needed to be in place between 2pm and 6pm NEM time, it’s one plausible explanation for the dip in demand seen occurring around 2pm on the chart above (i.e. before the price spike).
However, we can also see that the demand climbed rapidly back up to the same level, preceding the spike. It seems likely that this was non-related demand (e.g. distributed air-conditioning load) and that the 400MW of DSR seen immediately after this price spike was more directly in response to price exposure (either directly at the energy user, or indirectly at a retailer – calling optional DSR).
Regards
Paul
Paul,
Thanks for the analysis. Be aware that SPAusNet’s Distribution area is only one part of Victoria, probably about a fifth of Vic’s distribution connected industrial load. Their submission to the Power of Choice Review claims their CPP scheme achieves 70-80MW load reduction.
Thanks for the added points, Ben
At a more holistic level, I think we’re seeing the results of how Demand Side Response (in a variety of forms) is proving more widely accepted as a means of managing risk (physical and financial) than was the case a decade ago, or so.
Paul