Temperatures dropped around much of the NEM this evening, providing only the second occasion for prices to spike this winter (to date).
A. June to date
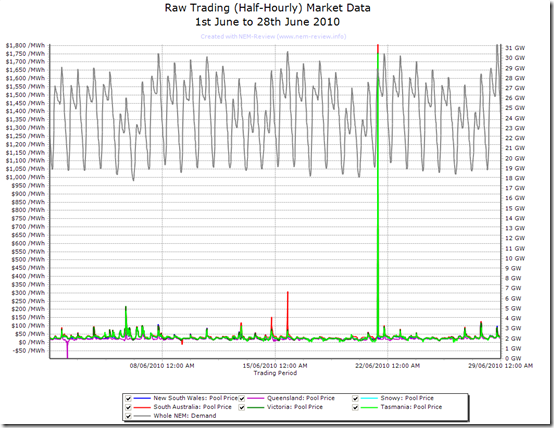
The following chart (generated from NEM-Review 6) shows how the month of June (up until this morning) had been distinctly uneventful, with just a price spike experienced, and NEM-wide demand not yet reaching 32,000MW.
This is one reason for the lack of posts at WattClarity this winter (so far).
B. Price spike this evening
Temperatures plunged this evening across much of the NEM, driving demand higher, and resulting in a price spike in NSW.
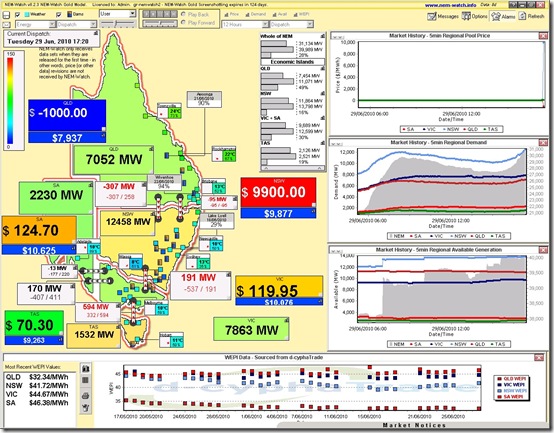
The following snapshot (taken from NEM-Watch 8) shows how prices in NSW spiked close to the current* level of the Market Price Cap (MPC), whilst at the same time prices in QLD plunging to the negative cap.
* the current MPC is $10,000/MWh, for just over 24 hours, rising to $12,500/MWh on 1st July
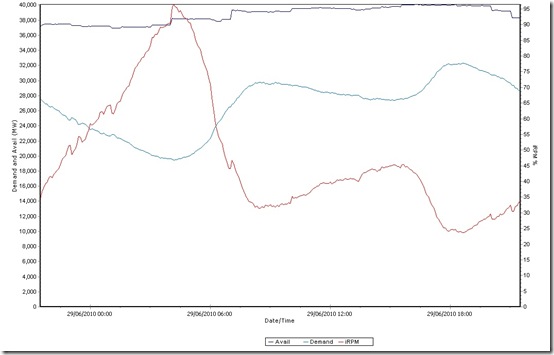
From within NEM-Watch 8, we have also generated the following chart to highlight how NEM-wide demand rose above 32,000MW for the first time this winter (reaching 32,304MW at 18:35 on a dispatch target basis).
At the same point in time, the Instantaneous Reserve Plant Margin (IRPM*) had dropped to the level of 23.64% – which is still a very healthy level, and an indication of why prices were subdued in the other regions.
* IRPM is the excess of available supplies over demand, and is a non-price-based indicator of the balance between supply and demand. Compare today’s lowest level to the record lowest-ever levels experienced in Winter 2007.
C. Some Historical context
I don’t have much time tonight to look in detail, but have put up this background to winter 2010 as a starting point for any further analysis we have time to do as the season progresses…


PS – just noted that the new AEMO website has this additional information here about the price spike on the 29th June.