On Saturday 22nd June we posted ‘Where’s the wind gone, through 2024 Q2? … with June perhaps even worse than April or May!’, which …
1) showed that the aggregate production of wind farms in 2024 Q2 might be worst since 2017 Q2; and also
2) understandably has generated some discussion in various locations.
Curiosity has been pulling us further, so we’ve started the process of looking at other portions of the supply side, and the demand side:
1) On Sunday 23rd June we posted ‘A similar trended view of the aggregate production from Hydro Discharge across the NEM through 2024 Q2’, which:
(a) Showed that hydro production levels were also low in 2024 Q2 compared to other comparable periods;
(b) But has not garnered anywhere near the same attention
2) Other aspects are coming … but we have a few things on, so might take some time to get through them all.
In this article we’ll have a look at gas-fired generation through Q2 till today (Tue 25th June 2024).
About Gas…
On Wednesday 19th June 2024 the AEMO published ‘East Coast Gas System Risk or Threat Notice’.
… that’s been followed by many articles in Mainstream Media, and also many comments on social media. No time to single out anything particularly interesting, but there has been a lot.
With respect to what follows, keep in mind that:
1) The gas supply system is more than just gas-powered generation:
(a) There are aspects upstream that are beyond our focus:
i. whilst the east coast gas grid is sort of interconnected, the dynamics are different from the real-time nature of the electricity grid, which all spins at 3000rpm together;
ii. there are obviously other specific aspects (like the Iona storage talked about in the AEMO Notice) that are impacting at present;
iii. which reminds me of the gas system constraints Simshauser and Gilmore wrote about in this working paper.
(b) There are also aspects of downstream gas usage that we don’t focus on … I’m particularly thinking about here both:
i. How increased gas usage in the southern regions for domestic heating (given the cold start to winter) will have played a role; and also
ii. The concerns of our friends in ‘major energy user land’ (such as members of the EUAA) that have concerns about possible interruptions to their supplies.
2) Our focus is on the National Electricity Market (not the gas grid) so there are bound to be aspects of the above we’re not aware of (or proficient to observe).
3) Because of the locational factors in the gas grid (and the regional nature of the NEM) there are probably nuances inside of this NEM-wide aggregate not covered here.
i. Like Tamar Valley CCGT getting a run; and
ii. Tallawarra B getting a start.
4) I don’t have a lot of time, so there’s lots of threads here that are unexplored.
Production from GPG through 2024 Q2 (to 25th June)
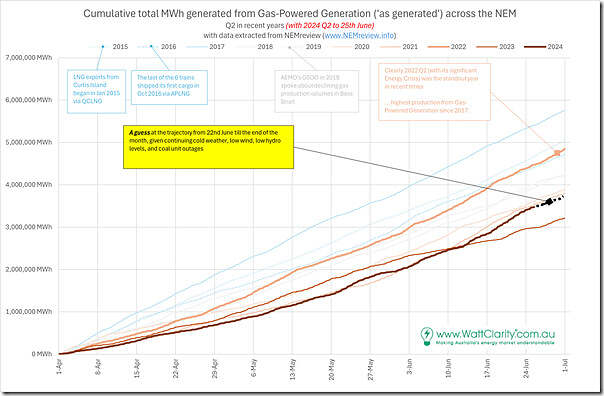
Following what we did for Wind and Hydro Discharge, here’s the same worm line chart for production levels from gas-fired generation throughout the NEM and spanning the whole of Q2 … with 2024 being to Tuesday 25th June 2024:
In this case we’ve selected the last 10 consecutive years … but important to keep in mind (my understanding is) that these really fall into three categories as implied:
Period 1 = the early couple years, where LNG exports had begun but not really cranked up to full throughput;
… in these years we can see higher production volumes from GPG (particularly in 2017)
Period 2 = with LNG exports cranked, and concerns starting to be voiced about decline in Bass Strait (and restrictions on further development of gas fields in VIC and NSW).
… production volumes from gas-fired generation decline (readers can read through the article ‘Transition Fooled?’ from 1st February 2021 by Allan O’Neil about this)
Period 3 = recent years.
… the decline continues, with the standout exception being the much higher use of gas-fired generation during the 2022 Energy Crisis.
Particularly for 2024 Q2 year-to-date, it was a very slow start to the quarter (lowest volumes of all 10 years), but we see that’s changed in June 2024. We saw this when we trended gas fired generation bids over the past 90 days to 22nd June using ez2view
Production from GPG just through June 2024 (to 25th June)
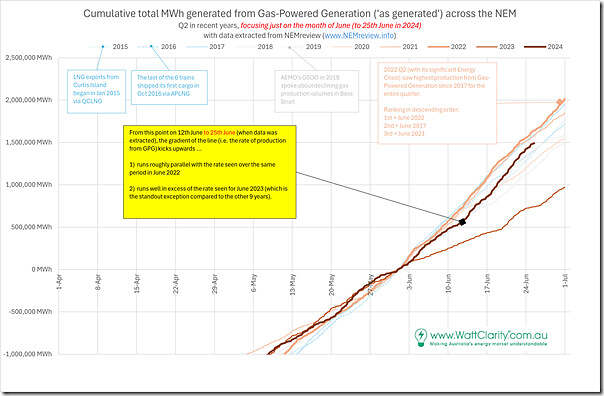
Resetting the zero axis and zooming in to look particularly at June, we see the different rate of production just for this month:
In this case, we see:
1) that the usage pattern of gas-fired generation in June 2024 ytd (i.e. gradient on the line) from 12th June is roughly equal highest in any of the years shown (equal to June 2022)
2) what particularly stands out is how much lower the gradient is for June 2023, for reasons not explored at this stage.
Apologies that it’s brief, but that’s all we have time for today…


Leave a comment