The widget was upgraded in late 2017 to show both the supply side and the demand side of the energy mix:
|
SUPPLY side. |
DEMAND side. |
|
At some point in future, we’ll post a similar explanation about electricity supply. |
On 24th April 2018 we posted this detailed explainer about electricity demand. We did this because many of the questions we’ve fielded about the widget relate to the demand side of the equation (for instance, many questions about why there is a “demand that AEMO doesn’t see” shown in the widget). |
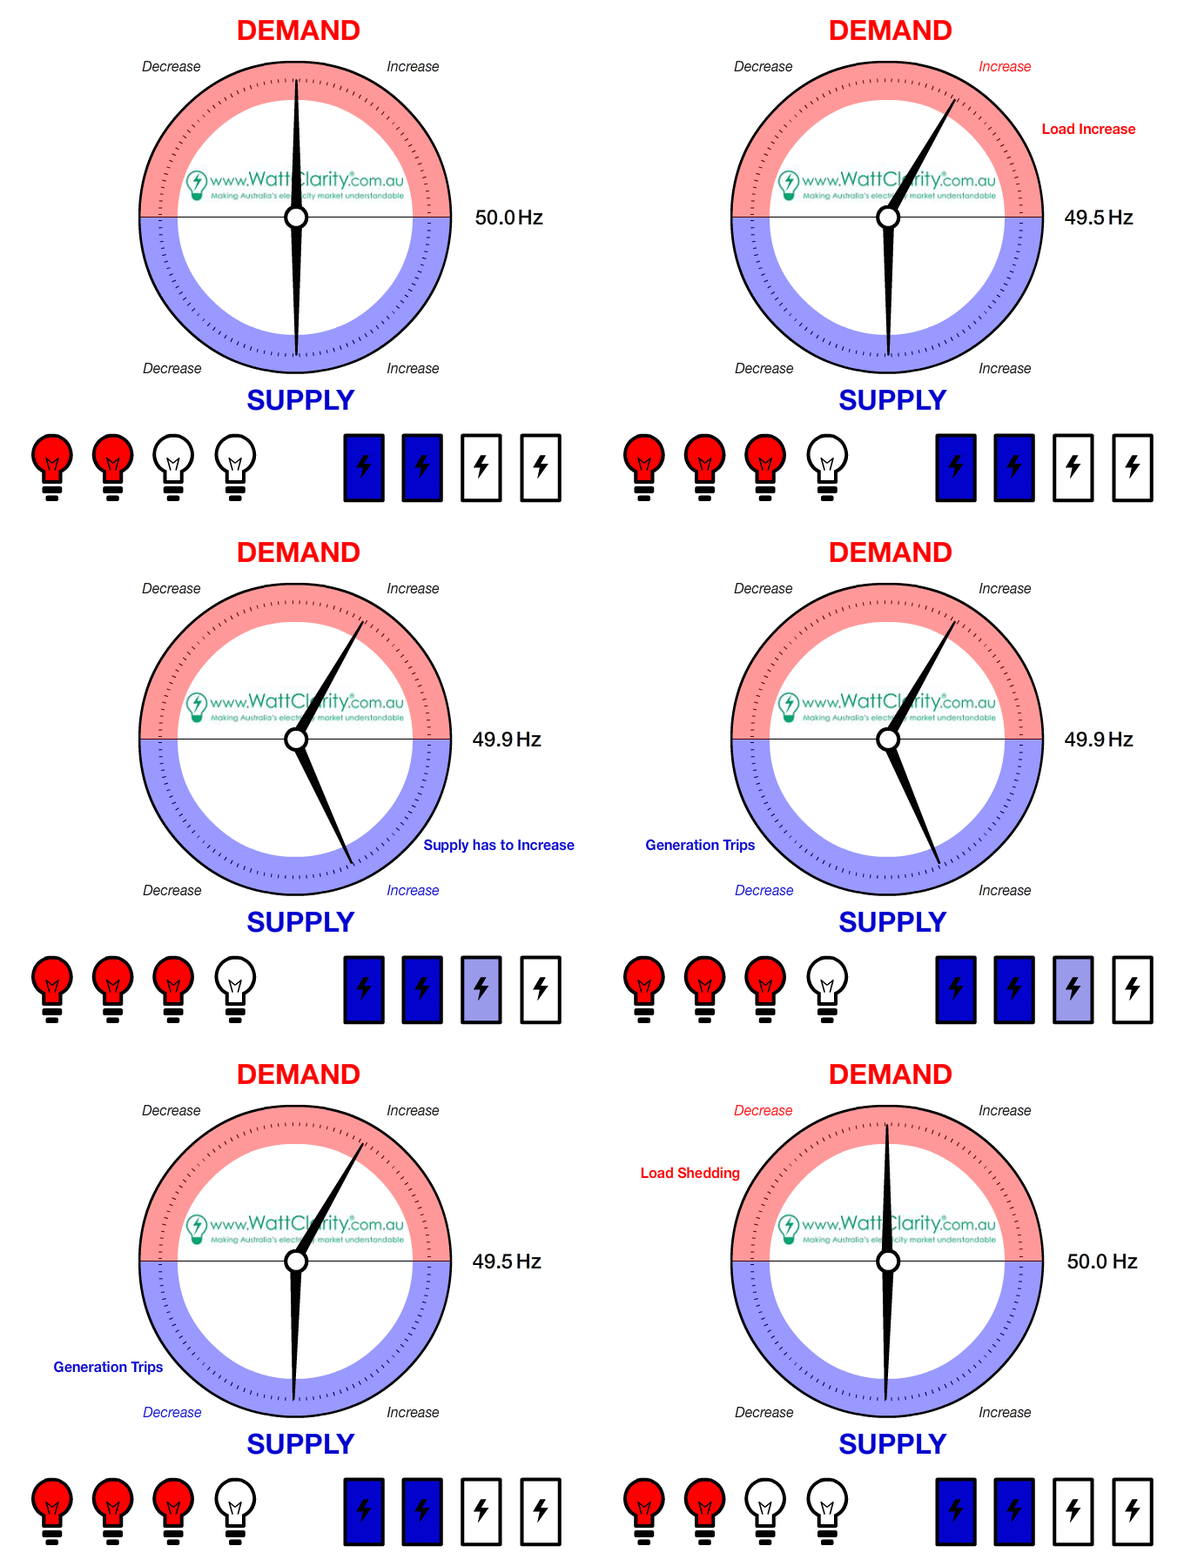
Both supply and demand are important, because they must always balance in real time for frequency to remain stable.
On 23rd March 2017 guest-author, Jonathon Dyson, posted this article ‘Let’s talk about FCAS’ on WattClarity that continues to prove a popularly read article on this site. In order to explain how the various FCAS commodities work, Daniel Lee developed this animated image highlighting how system frequency changes instantaneously in response to any imbalance between supply and demand:
It is useful in the context of this page to copy it in here:

Hence we know that, if system frequency is stable (bad things happen if this is not the case), then supply must be equal to demand at that instant in time.

