
As noted here, for every DUID that operated at some point through CAL2022, we include two pages of statistical data on the technical and commercial operations of the plant. We’re referring to the page on the left as the ‘A’ Page (described below), and the page on the right as the ‘B’ Page (described here).
(A) Genesis of the ‘A’ Page
Those who have their own copies of the preceding Generator Report Card 2018 will note the strong similarities between:
1) the ‘A’ Pages in subsequent GSD2019, GSD2020, GSD2021 and this GSD2022; and
2) what was provided in Part 3 of the GRC2018.
That’s deliberate!
Feedback we received from clients from 2019 to now reinforced the value of this statistical summary for each unit – matching our own experiences (we found reaching for the bound copy, or scanning the PDF, was the quickest way to get to the summary data we were looking for – or to explain to others).
(B) Structure of the ‘A’ Page
Taking one of the pages for the ~400 DUIDs (i.e. units) covered in the Generator Statistical Digest 2022, we’ve annotated to provide some context to what we have included:
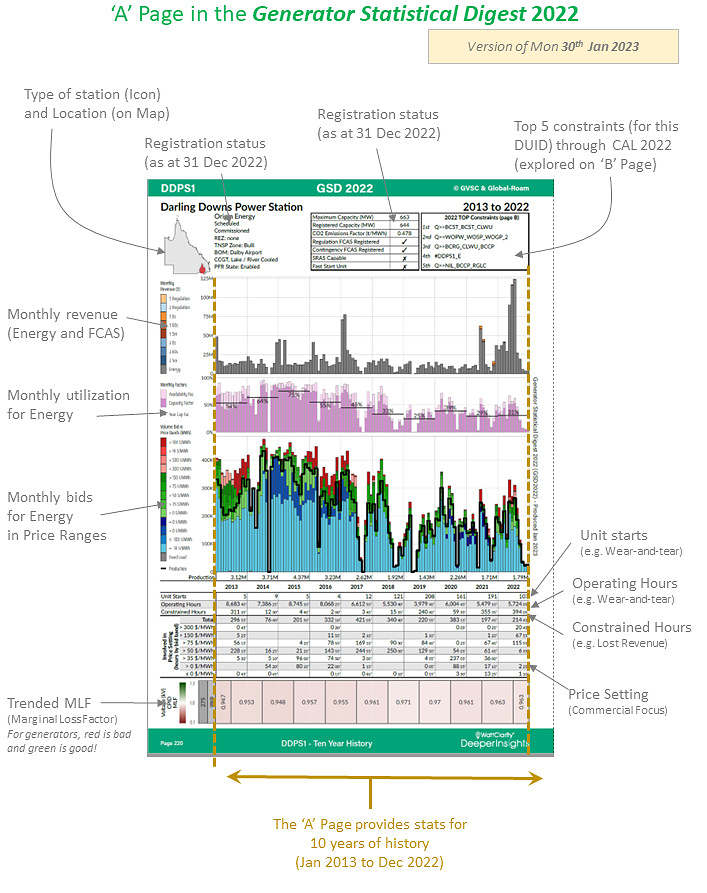
On this page we utilise 10 years of data (1st January 2013 to 31st December 2022) to compile technical and commercial performance statistics for the unit that’s the focus of that page.
In the table below, we provide more context to the data represented on each ‘A’ Page in the GSD2022:
| Data Sets Included | Brief Description |
| Meta Data, and Registration Status, for the Unit |
Referenced specifically ‘as at 31st December 2022’ at the top of the page we include information covering:
(a) Some technical/physical characteristics of the unit (type of project, location, size, approximate emissions intensity); and (b) Some commercial characteristics (Portfolio, Registration status, and whether it’s been registered for provision of Ancillary Services) |
| Trended monthly revenue | Across all nine commodities (Energy and FCAS) for each month over the 10-year period we trend a stacked calculation of revenue for the DUID.
—————- Examples of use… |
| Monthly Utilisation (for Energy) | Focusing specifically on the provision of Energy we look at the monthly aggregate availability and capacity factor, referenced to the unit’s Maximum Capacity (as registered with AEMO).
—————- In his article ‘Farewell Liddell’ on 31st January 2023, Allan O’Neil referenced this data for Liddell, Stanwell and Tarong power stations to highlight the significant difference in their operations over 10 years (2013 to 2022). |
| Monthly Bids in Bid Ranges (for Energy) | Using three basic colours (and shades within) we aggregate up the energy-constrained ‘True Volume’ of bids made by each DUID at the point of dispatch to deliver a clear picture of how the relevant Participant has positioned that asset for each month over the past 10 years.
—————- Examples of use… |
| Number of Unit Starts | Number of Starts (and hence number of full cycles) is a key performance metric for any unit. For instance, generators with large rotating mass will find number of starts a good initial representation of the likelihood of the unit suffering remnant life degradation due to fatigue.
—————- Back in March 2019 we wrote about ‘The death of baseload and rise of cycling’ to focus attention on how the aggregate statistics for number of unit starts was increasing significantly. In his article ‘Farewell Liddell’ on 31st January 2023, Allan O’Neil referenced this data for Liddell, Stanwell and Tarong power stations to highlight the significant difference in their reliability over 10 years (2013 to 2022). |
| Operating Hours | Operating hours is a key performance metric for any unit. For instance, thermal generators will find operating hours a good initial representation of the likelihood of the unit suffering remnant life degradation due to creep.
—————- Examples of use… |
| Constrained Hours | In the ‘A’ Page, a 10-year history is provided of the total number of hours in the year in which the DUID was affected by (one or more) bound constraint equations.
Note, in particular, that the “Top 5 Constraints” for the 2020 year are further explored for the most recent year in the adjoining ‘B’ Page of the GSD2022. —————- In ‘How good is Solar Farming?’ on 28th January 2019, Allan flags (referencing the prior GSD2019) how the impact of congestion through CAL 2019 manifest themselves as Headwind no 3. On 1st February 2021, Paul McArdle published the article ‘Which units were most impacted by constraints in 2020?’ exploring some of the insights accessible from the GSD2020 with respect to constraints. |
| Prime Involvement in Price Setting | The process by which prices are set (and dispatch happens) in the NEM is significantly more complex than the majority of people realise – which has been leading to unwanted surprises amongst a number of new entrant generators to the NEM. Over time we have invested in linking together a multi-level explanation about these concepts assembled in the Glossary.
—————- Examples of use… |
| Marginal Loss Factor (MLF) | Through WattClarity there are numerous articles that have been written over time, with some being tagged here.
—————- In particular, Allan’s article ‘How good is Solar Farming?’ on 28th January 2020 highlights how the (prior) GSD2019 makes it easy to spot check, across a broad number of units, how declines in MLF are presenting themselves as Headwind no 1. Particularly with reference to MLFs (moreso their reporting in GenInsights Quarterly Update than any particular Generator Statistical Digest), Dan Lee wrote about ‘On the fringes: the outer edges of the NEM remain the most prone to volatile MLFs’ on 30th June 2022. |
The advantage of this format is that it enables data to be reported, on the same basis, for all ENERGY-market operational DUIDs!