I don’t have much time this afternoon, so will briefly walk through (at a high level) what’s visible in terms of contributions for the South Australian region on Wednesday 12th February 2025…
1) with the ambition to revisit this day in subsequent articles (as time permits)
2) so what follows should be read moreso as questions for further analysis rather than ‘final’ observations
For comparison purposes, all images are from ez2view and span both Wednesday and the preceding day (Tuesday 11th February 2025) which was hot in South Australia, but nowhere near as stressful.
Imports from the East
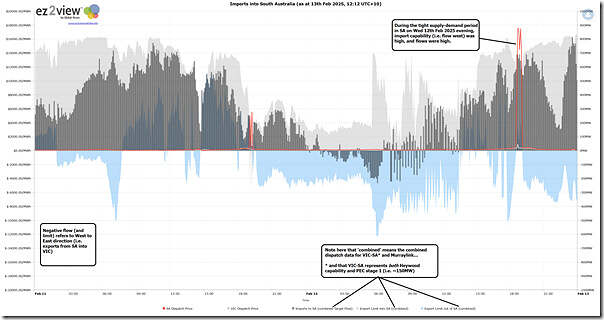
Let’s start with the following trend composed using the ‘Trends Engine’ within ez2view comprising ‘imports’ from the east over a combination of what is effectively now three different flow paths:
Flow Path 1 = the old Heywood interconnector; and
Flow Path 2 = the Murraylink DC interconnector; and
Flow Path 3 = PEC stage 1 which (as discussed by Allan on 28th January) is:
(a) Flow over Bunday (in SA) to Buronga (locationally in NSW, but at least at this point then flowing into VIC)
(b) Represented in NEMDE at this stage as an upgrade on the VIC-SA interconnector.
So here’s the aggregated view:
There are more layers of this onion still to peel … but:
1) (broadly speaking) we can observe that, when South Australia needed support most, flow and flow capability was strong from the east (though obviously not so strong as to keep prices from separating).
2) earlier in the day on Wednesday, we can certainly see the effect of the (glitch-induced?) oscillations on alternative import-export over the border.
Local Supply
So let’s move onto local supply …
Rooftop PV, and other
In this article we’ll skip over the contribution from rooftop PV, though obviously that’s very important. We’re also skipping supply from other invisible sources (for reasons that should be obvious).
Supply sources visible to AEMO
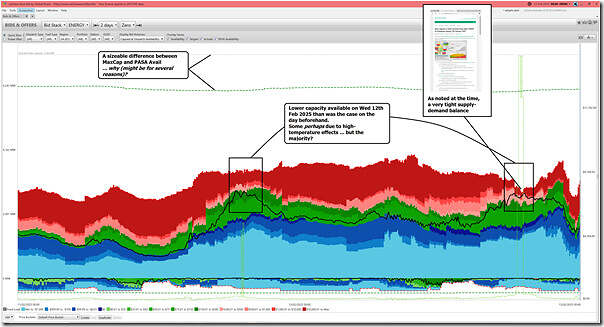
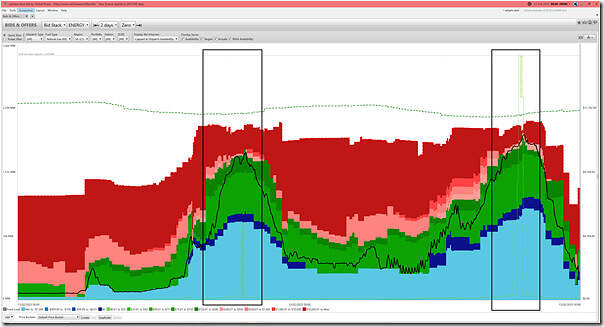
Let’s concentrate on the supply sources that the AEMO has real visibility of … supply from Scheduled, Semi-Scheduled and (a few select) Non-Scheduled assets. Utilising the ‘Bids & Offers’ widget within ez2view set at 24:00 at the end of Wednesday looking back two days, here’s the aggregate view:
As noted on the image, questions that immediately pop out include:
1) What’s the reason(s) behind the sizeable gap between aggregate Max Capacity and the PASA Avail of the fleet?
… some is probably due to commissioning of newer resources, but is that the only factor?
2) There’s obviously a sizeable gap below PASA Avail to actual capacity … what are the reasons for this? There will be many, no doubt!
3) What’s the difference for the obviously smaller aggregate availability (at any price) on Wednesday 12th during evening time and Tuesday 11th evening time?
… the difference is clearly a reason (in addition to the higher level of demand) that we were down to under 100MW of spare capacity on Wednesday evening!)
4) Plus more…
Within this bundle are various different technology/fuel types, so let’s quickly unbundle them. Given the emerging VRE+Firming paradigm that South Australia is experimenting with ahead of most of the rest of the world, we’ll go in that order …
VRE (Large Solar Production)
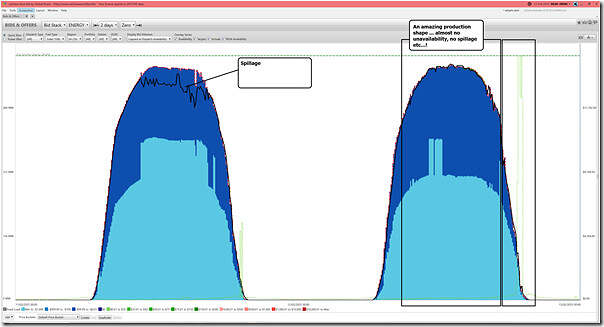
Filtering down to Large Solar, we see…
So there’s really a yin-and-yang story to tell in the production shape for Wednesday here:
1) Rough calculations yield an instantaneous capacity factor through many daylight hours of ~96%
(a) which is just remarkable (and so rarely seen in South Australia)!
(b) compare that to some obvious spillage in the prior day.
2) But the flip side was the low-and-rapidly-declining yield around the time of evening volatility.
VRE (Wind Production)
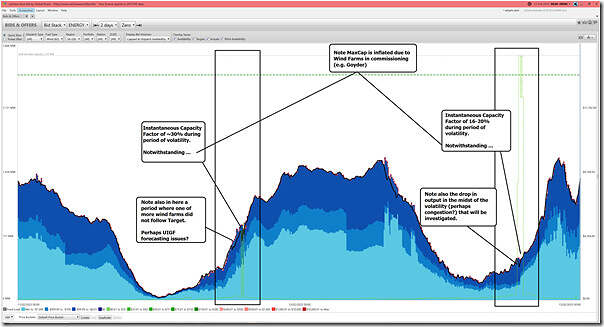
Filtering down to Wind, we see…
With respect to the above…
1) We note that the aggregate MaxCap figure for the wind fleet is (technically correct but) practically overstated due to wind farms still in commissioning but not in full output
… Goyder is one that comes to mind straight away, there may be others.
2) Notwithstanding that, it’s clear that:
(a) Unfortunately, peak production times did not coincide with the tight (and volatile) period on either evening
(b) But it was particularly low on Wednesday evening 12th February 2025.
3) Also what jumps out to me is a noticeable drop in output at (one or more) wind farms during the period of evening volatility
… will be interested in looking into that (perhaps congestion)
4) For completeness, a period during Tuesday afternoon when (one of more) wind farms appeared to have difficulty following target will also be of interest to explore.
Firming (Gas-Fired Production)
Filtering down to Gas-Fired Production, we see…
With respect to the above, we see:
1) A big gap between MaxCap and PASA Avail
… why?
2) But under PASA Avail, nearly everything was bid available, and nearly all of that was dispatched at the time of peak ‘Market Demand’ and Price.
3) Dispatch was a little higher on Wednesday compared to Tuesday.
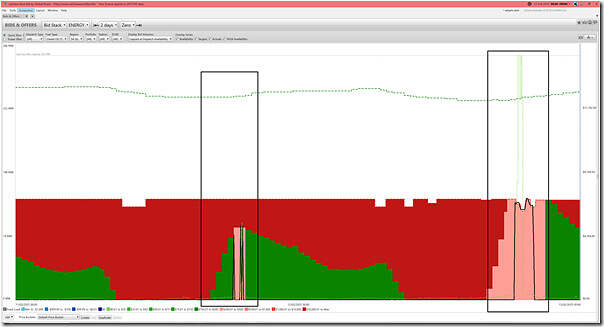
Firming (Liquid-Fired Production)
Filtering down to Liquid-Fired production units, we see…
Here, we see:
1) A big gap between MaxCap and PASA Avail
… why?
2) A quite different bidding approach on Tuesday compared to Wednesday:
(a) With more capacity offered at cheaper prices on Wednesday
(b) So utilisation considerably higher
3) But there’s a very large gap under PASA Avail and the Bid Availability.
… what’s the reason for this?
4) I have not looked, but assume that Port Lincoln and Snuggery were not bidding at the time (given they are mothballed and only out-of-market reserves)
Firming (BESS Injections)
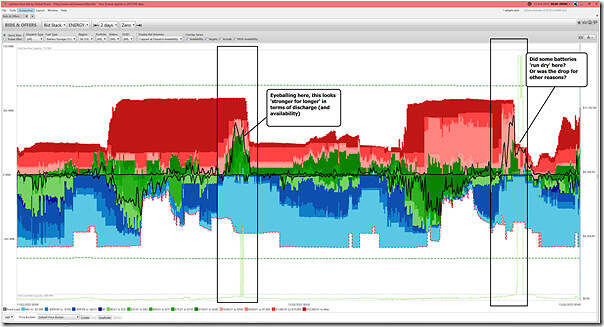
Filtering down to BESS (and remembering that post IESS we have injections to the grid as positive numbers and withdrawals from the grid as negative numbers), we see…
From this there are some obvious questions:
1) A big gap between MaxCap and PASA Avail
… is this (just) due to commissioning of some new battery?
2) Why did batteries discharge so much more strongly before the price spiked, whereas it looks like some of them ‘ran dry’ as the price started ramping up …
… or, should readers acknowledge a bit of ‘chicken and egg’ here (i.e. did them running strongly earlier in the evening prevent the price hitting the roof then)?
3) Whatever the measure, what does this real world case study have to teach us of the required duration of storage required to properly firm…
… and how different is the real world case study than the spreadsheet or other models used for system planning or business case planning?
Firming (Negawatts)
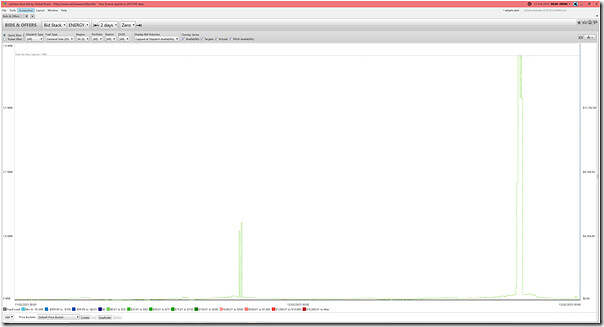
Filtering down to Negawatts, we see…
… nothing!
Whilst the scale is small my main observation from this is that, for those promoting Negawatts as a method of firming, the evidence (and this is just one more case) suggests that it is very much not firm.
So that’s all for Part 1 of exploring one of three main questions we have identified.


Leave a comment