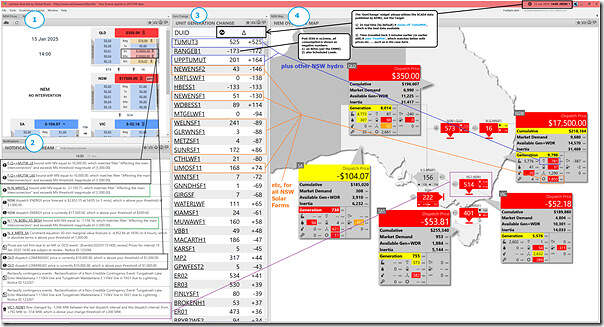
As the final article today, here’s a collage of 4 different widgets in ez2view again time-travelled back to the 14:00 dispatch interval:
With respect to the four widgets shown:
1) In the top-left we have the ‘NEM Prices’ widget:
(a) Which obviously shows the NSW spot price for energy at the Market Price Cap, and also QLD elevated and VIC gone the other way;
(b) But it also shows the Contingency Lower FCAS prices in QLD (L6s and L60s) spiked as well, because of the constraint equations bound.
2) In the ‘Notifications’ widget we see:
(a) The binding of four significant constraints in this dispatch interval; and
(b) The prices up, as noted above; but also
(c) The significant change in Target Flow on the VIC1-NSW1 interconnector
3) In the ‘Gen Change’ widget, noting that this is utilising FinalMW because it’s in time-travel, we see change (from 13:55 to 14:00) across the NEM, sorted in descending (absolute) magnitude of change.
(a) We can see two units at Snowy Hydro making up the bulk of the 781MW of aggregate supply in NSW … with big increases in both.
(b) We can also see many solar farms in NSW ramping down:
i. Not just the New England Solar Farm;
ii. But others as well.
4) The ‘NEM Map’ widget we have seen in earlier articles.
So we’ll leave this here for this evening…


Leave a comment