It’s Monday evening, so now more than 6 days since QLD came close to ‘lights out’ as a result of a catastrophic failure at Callide C4 – leading to a chain reaction of other events – but thankfully, as Allan reminded us earlier, some things went right!
Despite all of the articles that have been contributed to WattClarity here during and since that event, we’ve still much we could do in exploring these 7 Headline Questions (+ others that keep occurring to us). So I thought this evening I’d take a helicopter view of how bidding changed though the afternoon
(A) Overview data
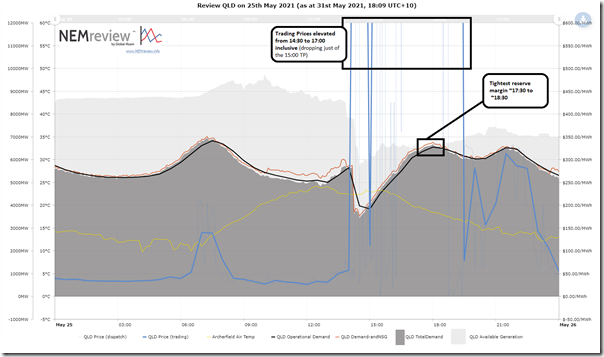
Here’s a chart from NEMreview v7 that can remind us what happened through the day:
For those with their own licence, you can access a copy of the query here.
I’ve highlighted the period of elevated prices, and also the period with the tightest supply/demand balance.
(B) Summary bids across the QLD Region, all supply-side units
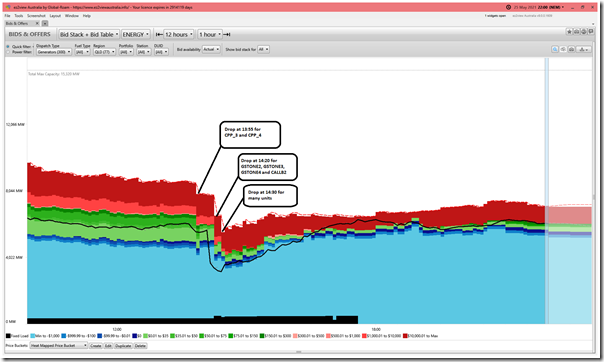
Using a pre-release of ez2view version 9.0 (i.e. for Five Minute Settlement) I am testing out (caution – there may be bugs we’ve not sorted yet) I’ve shown the trend of bids through the day up until 22:00 (chosen as it’s well past the volatile period):
I’ve annotated with the significant changes (might have missed some units).
(C) Bids by sub-set of units
Taking the QLD region and then looking via portfolio and/or fuel type, we see the following trends. Some very quick (cursory) initial comments are included:
(C1) Bids for Callide Power Trading
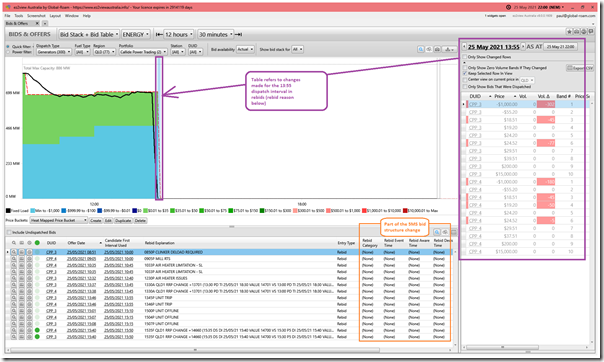
It clearly was not a good day for Callide Power Trading (the portfolio/entity used to submit bids for Callide C on behalf of the JV owners – CS Energy and OzGen (i.e. InterGen and others). Here’s the bid structure:
Also in the table underneath are the sequence of bids through the 12 hour period.
(C2) Bids for CS Energy
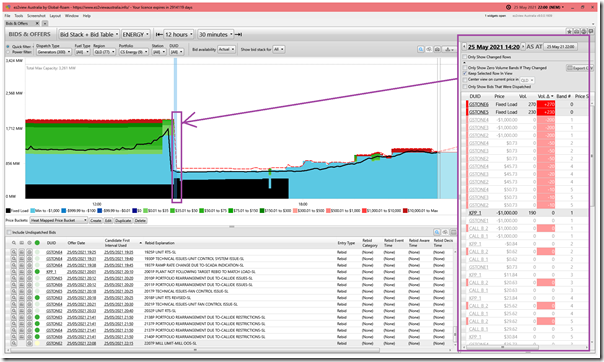
It wasn’t a good day for CS Energy either:
Aggregate capacity bid into the market (1920MW) was significantly lower than Max Capacity (3,261MW) even before the catastrophe happened. The aggregate output was ramping up even prior to the Callide C dramas – and accelerated after that, until the trip.
Then (at 14:20) aggregate volumes bid was reduced further to only 730MW following the trips in the 14:10 dispatch interval noted here.
(C3) Bids for InterGen
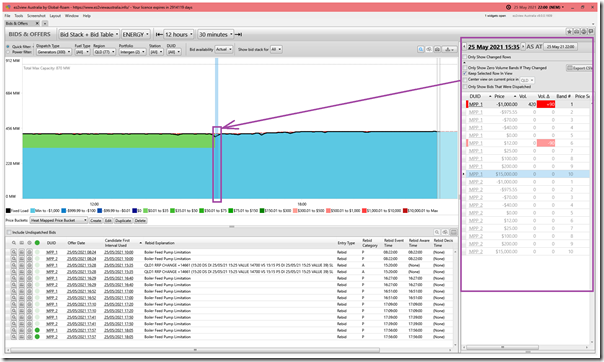
We can see Millmerran unit 2 was offline for the day – and that unit 1 also had some limitations on its boiler feed pumps:
Volume was shifted down to –$1,000/MWh from 15:35.
(C4) Bids for Stanwell
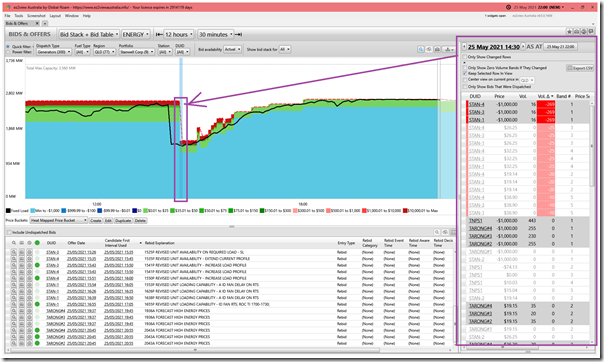
In his article earlier, Allan’s already noted how the Stanwell unit’s ‘trip to house load’ was a success for the day:
Above is how the units recovered, in their bids, as part of the larger portfolio. All bid prices were under $300/MWh (i.e. green and blue colours) from 16:05.
(C5) Bids for CleanCo
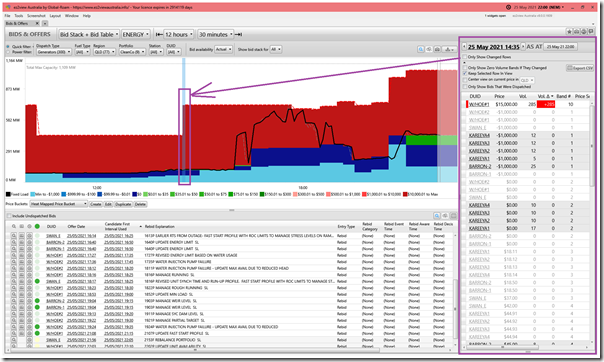
Quite distinct from the portfolios above, there was a large volume of energy bid in the red (i.e. >$10,000/MWh) price ranges:
This was because (at least in large part) much of the energy offered was hydro, and so energy limited. Hence high price bids is the method used to manage state of charge and avoiding running dry too soon
We also see Swanbank E offer more capacity from 20:35 (after coming online 18:35) – a great working example of the use of different types of dispatchable plant in a portfolio (part of the logic I’d envisaged in advocating for the creation of CleanCo in the first place).
(C6) Bids for all Large Solar Farms in QLD
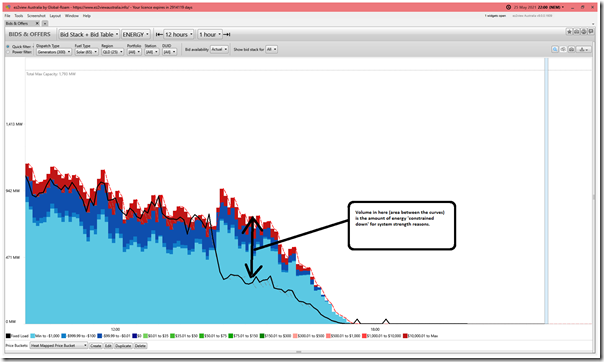
Here are all of the solar farms in QLD – showing ‘true/actual’ bids, adjusted for energy constraints:
A couple points here:
1) I’ve highlighted the volume spilled because of system strength constraints identified in this article from Wednesday last week (although remember Marcelle’s caveat that it’s not as simple as it might seem to calculate!)
2) Showing energy limited (i.e. actual) bids we see volume down to 0MW by 17:30 … which coincides with tightest supply/demand balance in the top chart.
3) For reasons not apparent to me at this point, there was a non-trivial volume of energy still offered >>$300/MWh up until 16:40 (I can’t understand why without digging further!?)
(C7) Bids for 2 x Wind Farms in QLD
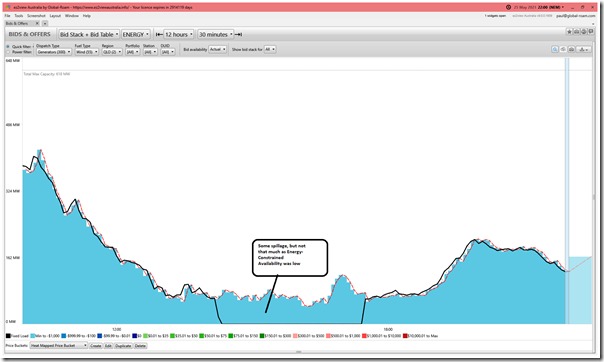
Here’s the 2 x Wind Farms in QLD
There was still energy spilled – but it was not that much (wind speeds were low, or some other plant reasons?)
No bids above –$1,000/MWh through an afternoon with sky-high prices!
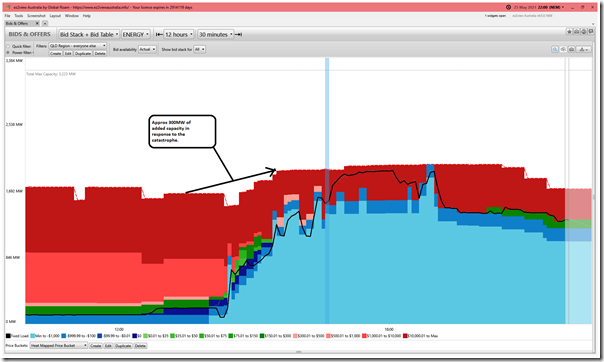
(C8) Bids for ‘Everything Else’
If I have set up my exclusion query in ez2view correctly, then this should be everything else not covered in one of the categories above:
This includes the Braemar units, Oakey, Yabulu, Mt Stuart and so on.
We can see both an increased volume offered to the market, and a significantly increases share of this offered below $0/MWh in response to what occurred in the early afternoon.
We can also see the vast majority of the capacity was used through the evening peak time, as underlying demand rose and solar production faded away.
That’s all I have time for tonight…


Leave a comment