Editor’s Note about this Extract:
On 16th October 2020, guest author Stephen Wilson posted an article on WattClarity titled ‘Does the NEM need to be redesigned?’.
Some time later, we’ve taken the step of lifting out part of that article as a separate excerpt titled ‘The Market means different timescales’ in order that this principle can be referenced directly in subsequent articles here on this site.
.
The Market means different timescales
In introducing the panel discussion, I asked panelists and the audience two questions:
What do we mean by “market design”? and
What do we mean by “electricity markets”? —emphasising the plural.
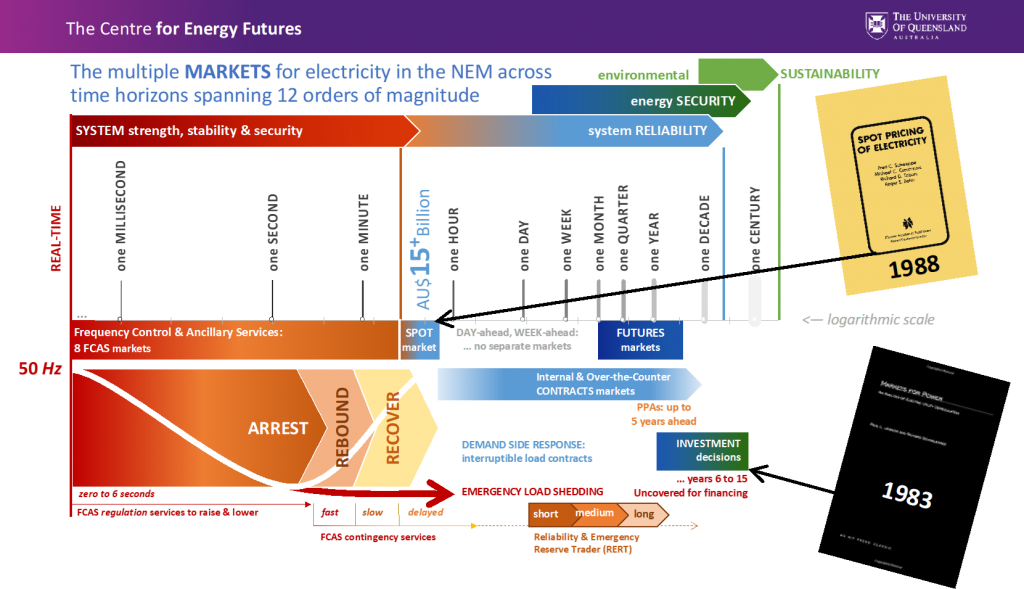
To provide some structure for the discussion, I shared a schematic diagram that I have found helpful both as a framework for my own thinking, and to refer to in conversations.

The diagram uses a log scale that spans from a century in the future back to real time, representing continuously scrolling time horizons that span twelve orders of magnitude: a trillion-fold difference. When people talk about electricity markets, they are usually thinking about only part of this scale, a few orders of magnitude, not the entire time frame. Journal papers on generator unit commitment for example, talk about two weeks as ‘long-term.’ For papers on emissions and environmental sustainability, a year is the very short term. The full business development cycle for new power generation can easily take five to ten years.
Many different types of computer models are used to understand what is happening and what would happen in a power system under various conditions. Even in 2020, we still do not have the computing power and capability to build one model that can look across the entire time horizon from real time to many decades.
At least three different models are required to gain a reasonable picture, and it is not yet practical or possible to ‘soft-link’ those models. That is before considering things like the coupling between electricity and gas (or hydrogen) and the complex feedbacks between energy, the economy, and the environment. I have heard of utility companies in the U.S. using as many as six or seven separate models to support decision-making. Bethany Frew from the National Renewable Energy Laboratory (NREL) in Colorado presented on work underway to develop a new suite of models that link electricity market outcomes with investment.
The time horizon diagram above is presented from an operational point of view: looking forward in time. System operators, market operators, power plant operators, plant owners, and investors are forward-looking. If we were to arrange those parties on our time scale, they would appear in the order just mentioned, from left-to-right.
From a planner’s point of view, the time scale appears as a mirror image. If you lift your finger and flick a switch on now, there is a 99.998% probability that your light—or your large industrial motor—will be energised. That is because of a long chain of historical decisions and actions, in a mirror image of the chart above that stretches back a century and more to Faraday, Maxwell and Einstein; Tesla, Edison and Westinghouse; Monash, Hudson and Schweppe, and countless others in a chain of technology, resource and project development, investments, industry standards, legislation, regulation and market design.
Close to real time, we are concerned about the strength, stability and security of the AC power system. Looking further ahead we are concerned about power system reliability and energy security more generally. Environmental sustainability is a longer-term issue.
An energy spot market is in the middle of our log scale and at the core of many market designs, including Eastern Australia’s National Electricity Market of five interconnected regions, which we call the NEM. The spot market design problem was solved by Professor Schweppe and colleagues at MIT in the 1980s. The link below to Professor Hogan’s viewpoint article extends that thinking from marginal cost pricing to scarcity and abundance pricing.
Our spot market exists in a daily cycle of bids managed by AEMO for the 5-minute to half-hour time windows. More than AU$15 Billion churns through that market each year for about 200 million MWh of energy.
In the WattClarity Glossary, there are a collection of articles that help explain how dispatch works, and prices are set in the NEM which have been useful for many.
.
Futures markets—on financial exchanges separate from AEMO—exist in the monthly, quarterly and yearly windows. In Australia’s NEM we don’t have separate day-ahead or week-ahead markets. Internal contracts between the generation and retail arms of companies and Over-the-Counter (OTC) contracts markets perhaps bridge that interval.
Investment decisions need to look ahead a decade or three. Investors are increasingly—but not exclusively—interested in environmental sustainability. A very important topic for market design is price signals for investment, as Joskow and Schmalensee discussed in an MIT podcast interview in 2019 about their 1983 book.
From this point you can return to the original article for more context.
.


Leave a comment