It’s 18:30 and I’m exhausted.
All I’ve been doing during the afternoon is watching our various displays, trying to understand what’s been unfolding, whilst responding to customer queries as they have arrived (oh, and providing some updates on Twitter and LinkedIn to the people who follow me there).
1) We’ve not been responsible for keeping the lights on – though we do understand our various software packages have been helping those who are responsible in various ways to juggle the masses of information that’s been coming in.
1a) Coincidentally today we have managed to release a new version of the ‘NEM Prices’ Widget in ez2view, and we had time to let a few clients know about this. Great for delving more into the impact of intervention this afternoon.
1b) It’s in your installed software, coming soon to your ez2view online access as well so you can use on your phone.
2) I certainly feel for the staff in much more stressful roles in the various electricity-sector related control rooms across the NEM (in the AEMO, the transmission and distribution networks, the generation dispatch desks – and also the control rooms in the large energy users).
3) I also feel for any families who’ve had to endure sweltering conditions in NSW and VIC without the benefit of air-conditioning in cases where local (temperature-related) network outages have caused grief.
4) I also know that we won’t be out of the woods for another hour or two, as solar is fading out whilst the tight supply/demand remains
This morning I did write “Buckle in folks, Friday afternoon/evening might be a bit bumpy” – so I can’t say I was not surprised by the general gist of what has been transpiring, though there are always unique twists and turns in the dramas.
Because I’m fried, I’m only going to make one comment now (about really what was the genesis of all this stress), and hope to come back to this on the weekend sometime and take more of a look …
NEM-wide Scheduled Demand hit levels never seen before (excepting January 2009)
Temperatures were extreme across NSW and VIC for much of the day.
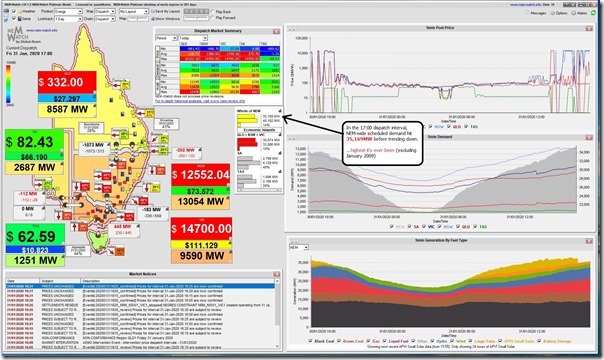
This drove demand in both these regions to high levels – which, whilst not at region-specific records, did combine to drive NEM-Wide Scheduled Demand to the massive level of 35,169MW at 17:00 – as shown in this snapshot here from NEMwatch v10:
Note that this level is not (mathematically) an ‘all time record’.
As discussed here 11 years ago almost to the day, Thursday 29th January 2009 saw NEM-wide Scheduled Demand hit 35,478MW at 15:50 (so 309MW higher than today) on that fateful day – only 8 days before ‘Black Saturday’…
However, today’s levels were reached at 17:00 even though a lot of demand was ‘missing’ in various ways:
1) Behind the meter rooftop PV has a much higher contribution now which (even if much reduced through the waning afternoon) was still significant – reducing Scheduled Demand by about 1,400MW at the 17:00 dispatch interval, when the high point today was set.
2) We have the loss of consumption at Alcoa’s Portland Aluminium Smelter in VIC as a result of transmission damage, which also resulted in Heywood tripping. That’s 600MW or so.
3) There’s also a rather large and obvious reduction in demand in NSW (about 300MW at 15:30) – no guesses on that one
4) We also had Reserve Trader triggered in NSW and VIC of unknown amounts – will know more tomorrow.
So, altogether we could ‘add back in’ >2,300MW of ‘lost consumption’ back on top of the Scheduled Demand number today to realise how remarkable it actually was (notwithstanding the fact that Jan 2009 also had ‘lost consumption’ in its own ways then).
That’s all for now, folks!


After the trip of the 500kV transmission line at 1:45 pm Friday due to 8 towers being blown over just west of Geelong, it is interesting that the Mortlake gas power station now fully supplying the Portland aluminium smelter as a local circuit independent of both the Vic and SA networks. While the transmission structures are intact to connect this circuit to SA, by operating as a local circuit it doesn’t need to meet the NEM standards of requiring alternative energy paths in case of circuit trips, as well as standards of inertia, frequency control, etc.. These protocols of a local circuit from Mortlake were presumably developed in response to a power outage several years ago that was long enough that caused potlines to solidify.
Malcolm – some market view dashboards (eg AEMO’s own website) may give the impression Mortlake and Portland smelter are isolated from both regions, but they remain connected to the SA network through Heywood. The zero target flows shown on the Heywood interconnector are an artefact of the way dispatch in the SA + SW Victoria “island” is being managed. I’m sure Paul will post an update giving more details later this weekend. Allan
Hi,
When you remark “no guesses on that one” regarding the 15:30 NSW demand reduction, do you mean that the demand reduction is obvious or that you’re unsure about what caused the demand reduction?