
Solar-Battery Hybrid Business Model
This article is a re-written summary of our findings regarding a business model for the All-Energy 2019 conference in October 2019. This business model compromised a battery, solar farm and hedge contracts.
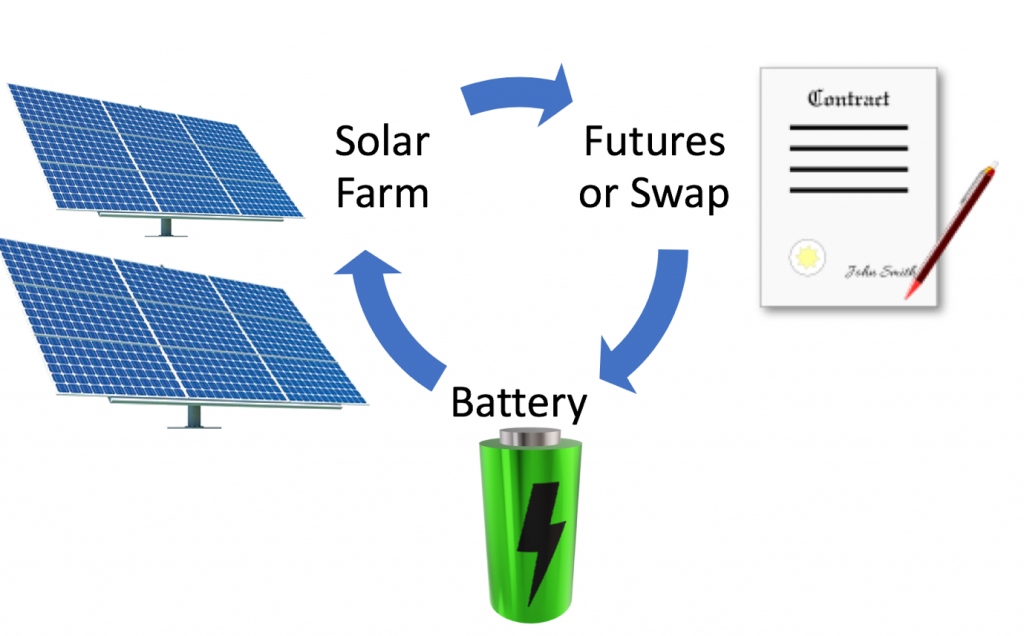
In our view, investing in a battery, solar farm or hedging contract in isolation is speculative, and each of these potential revenue streams is impacted by underlying spot price volatility. As an alternative, the use of these in combination is complementary and may improve revenue certainty. This portfolio approach is essentially the same as that taken by conventional generation.
Solar farm model
To perform this study, we first created a model of a hypothetical solar farm located at Brisbane airport where we sourced 5 years of hourly solar data (2014-2018). This solar farm had a 20MW DC peak rating and historic half-hourly spot prices were employed. The revenue for each half-hour was calculated and when the annual results were summarized, annual Earnings per unit of energy averaged between $56 to $112/MWh, as shown in figure 1.
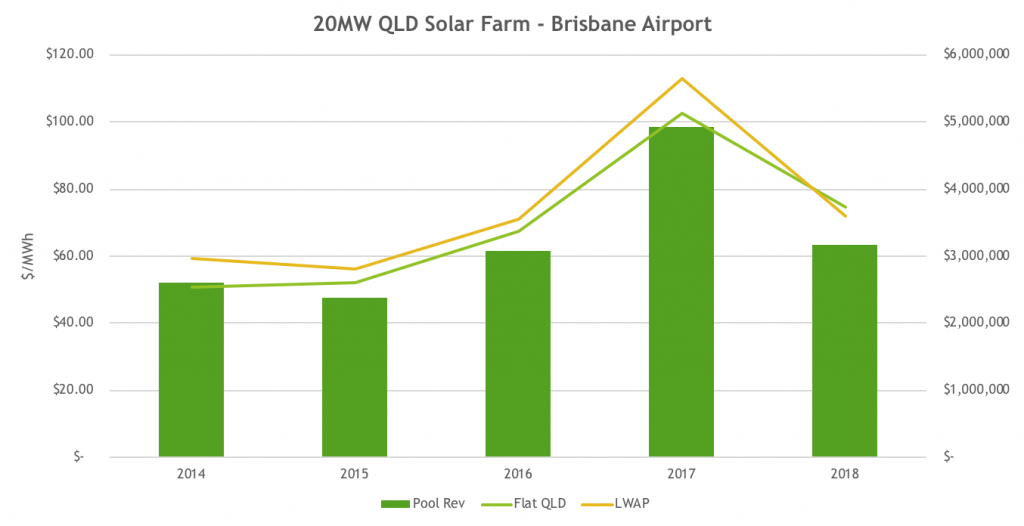 Figure 1 – Annual revenues and average price for Brisbane Airport 20MW solar farm
Energy Storage Economics
In my work in the last four to five years, I’ve examined many business cases for energy storage in Residential, Commercial & Industrial and Utility scale projects. Whilst it’s true that the cost side economics improve with scale, usually revenues may be less per unit of energy and much less certain. It’s also observable that almost all large (>1MWh) batteries rely upon subsidy or are “proof of concept”. Under this scenario, uncertainty in revenue makes financing difficult and significant equity investment is required for a battery project to be realised. It is likely that the most certain business case for a large battery is for regular demand reduction each month/year where a stable network demand tariff exists.
To examine the value of battery earnings, we measured arbitrage in Queensland over 20 years using “perfect foresight” where the battery charges at the lowest priced periods and discharges at the highest price periods every single day. It should be noted that we would expect actual performance to be less than this as you cannot predict with certainty when the prices will be highest and especially because of the impact of price spikes late in the half-hour which were unexpected. (*Currently the energy market dispatches every 5 minutes but financially settles as the half-hourly average, which will change to 5-minute settlement from July 1, 2020, so we have charted both in figure 2)
We also assumed that the batteries had 90% round trip efficiency, performed only a single cycle every day and compared different C-ratings.
C-rating |
Charge/Discharge Time |
| 2.0 C | 30 minutes |
| 1.0 C | 1 hour |
| 0.5 C | 2 hours |
| 0.25 C | 4 hours |
Table 1 – C-rating vs Charge/discharge time
The calculated values in figure 2 are $/MWh daily average for the year i.e. annual returns will be that value multiplied by 365/366 days.
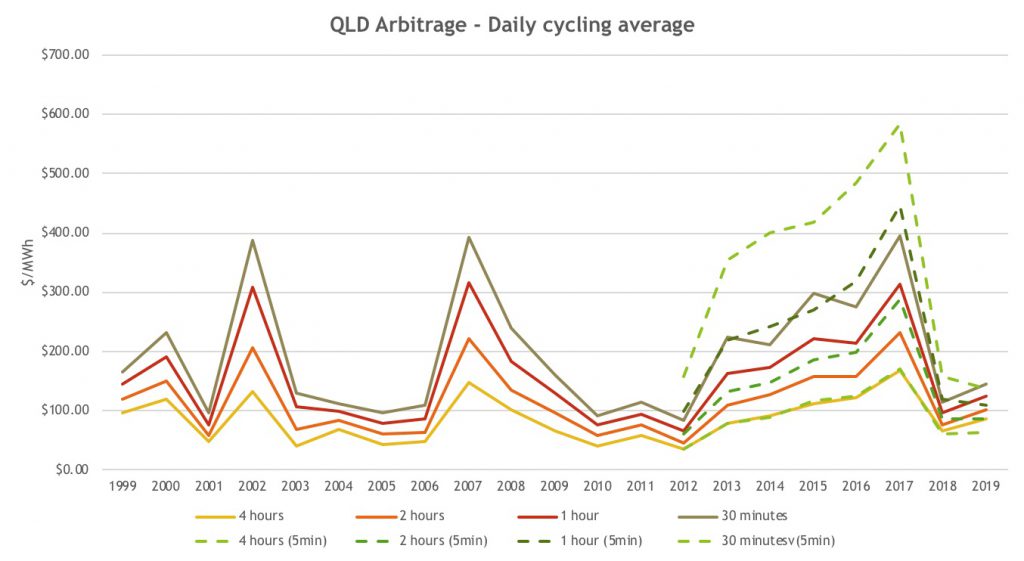
Figure 2 – Arbitrage performance QLD
Frequency Control Ancillary Services
In addition to wholesale market arbitrage an Energy Storage that is large enough (>=1MW) can participate in Frequency Control Ancillary Services (FCAS) that AEMO uses to keep the energy market within frequency limits and the grid stable. There are eight markets that exist (Raise (Regulation & Contingency (6s, 60s, 5 minute)) & Lower (Regulation & Contingency (6s, 60s, 5 minute)).
Historically, this has been approximately $200m/pa (~1% of energy market) in 2017 and 2018. This is highly variable, worth little most of the time, but highly valuable for short periods of time. It is also extremely difficult to forecast, so we have ignored this revenue opportunity in the interests of maintaining model simplicity. We have however prepared some summary charts of these market values in the following charts.
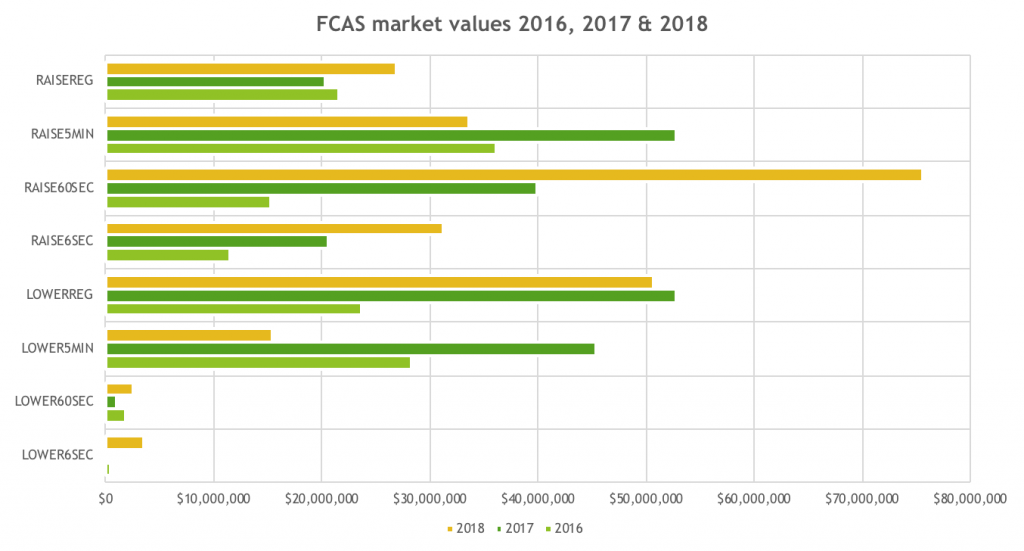 Figure 3 –FCAS Service revenues by Year (2016-2018)
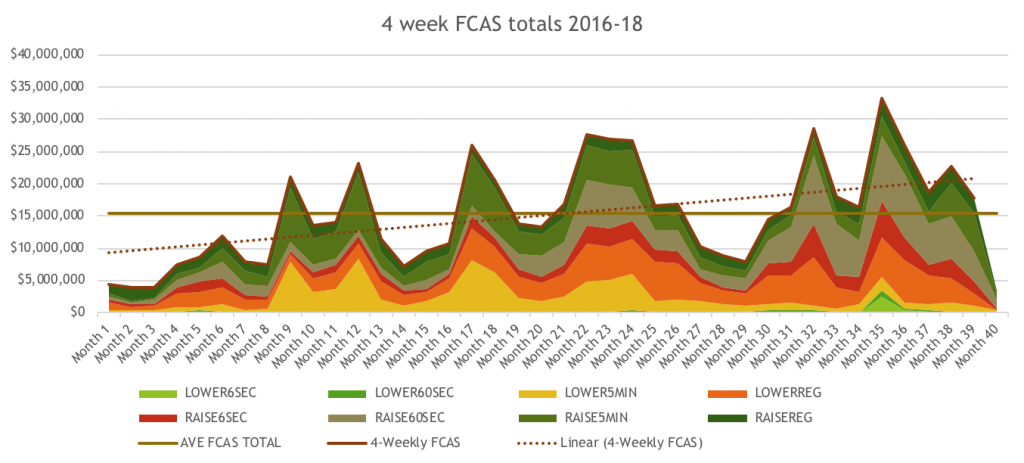
Figure 4 – 4-weekly revenue totals for FCAS from 2016-2018
Modelling Solar & Battery Behaviour
We modelled the solar farm, battery and contract together. It’s important to understand that to keep this analysis simple we also turned off settings that we’d usually employ such as battery and PV degradation, and we did not employ any constraints on the connection point (i.e. both battery and solar farm can operate at full power, anytime). Figure 5 shows a day of sample output from the model.
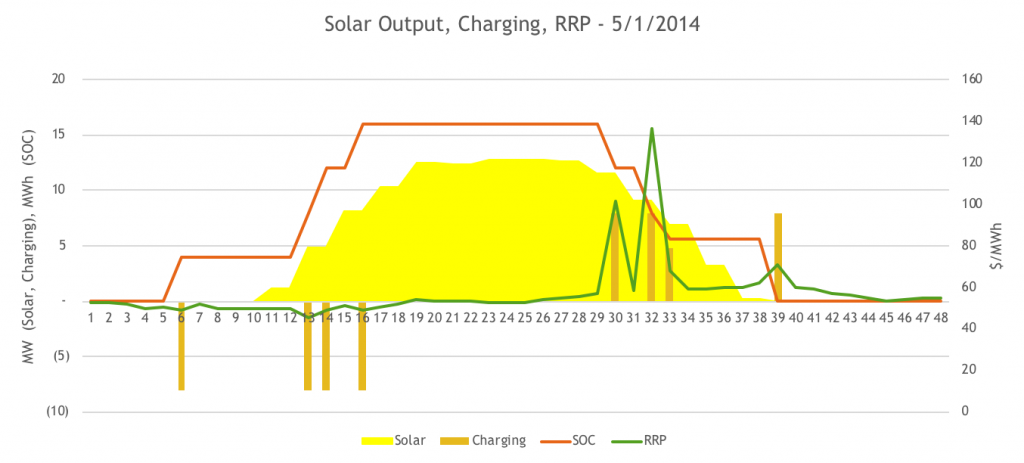
Figure 5 – Modelled output 5th Jan 2014
Hedging Contracts
There are a few common contracts available in the National Electricity Market
- Flat Swap Contract (24/7 for quarters/years)
- Cap Contract contracts that pay when spot price exceeds $300/MWh
- Peak swap contracts (7am to 10pm, working weekdays)
For our analysis, we will employ peak swaps as these are the closest standard contract to a solar profile as there are no hedges in place at night when there is no solar generation. This is an Imperfect hedge, but the product has market liquidity because of demand from retailers. We have chosen to hedge at level to minimise average exposure to effectively zero, which is illustrated in figure 4 (i.e. on average, A+B+C=0). This value was 8.0 MW.
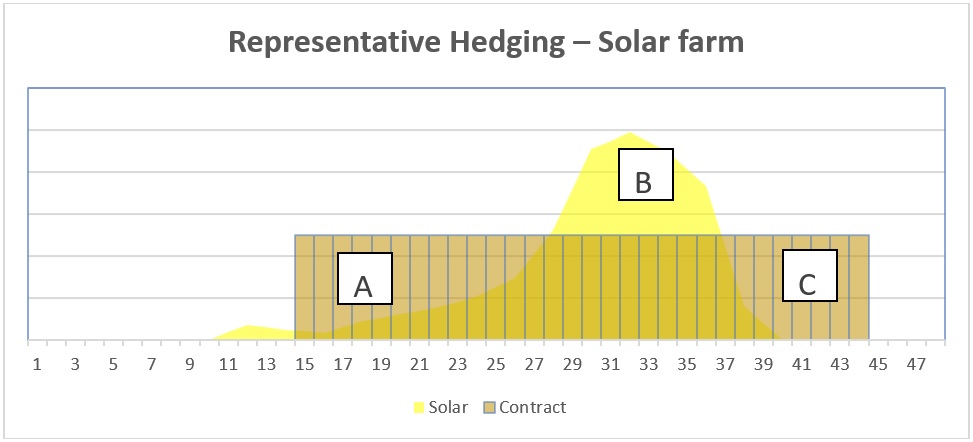 Figure 6 – Representative hedging
We have used an ASX energy price of Calendar 2020 price of $87/MWh in Queensland from late October as a representative price (www.asxenergy.com.au).
Modelling Results
The total revenues were then added for the battery, solar farm and contract position. As expected, the physical assets provide a variable but positive return but, in this modelling, the contract position cost money in 2017 but was positive in all other years. This would be expected as selling a hedge is an insurance to the buyer. Notably, in the long run, the contract was revenue positive and improved revenue certainty. We kept the battery as small as possible, so our default analysis used an 8MW, 2.0C battery.
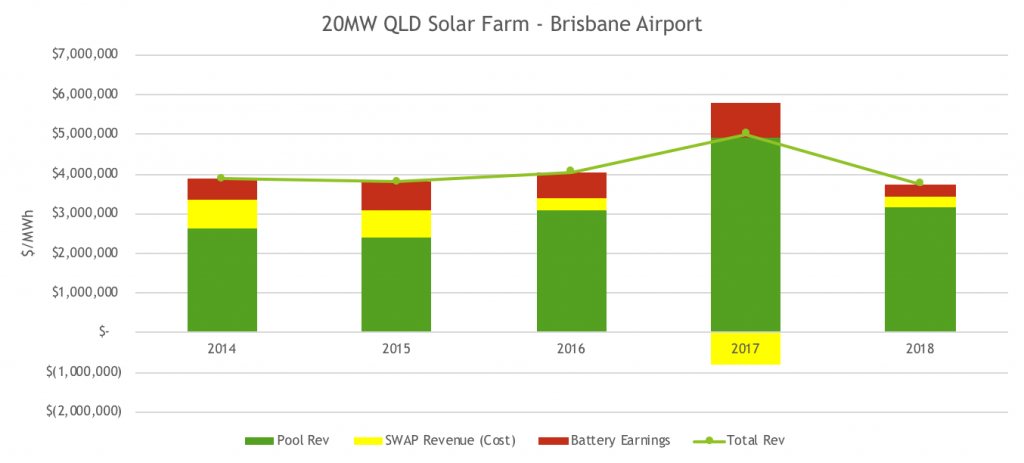
Figure 7 – Financial results of hybrid model
Whilst we used a 2.0C battery, we have not assumed a cost for the solar farm and most importantly, the battery. Further modelling was performed, where a lower C-rating was employed but the battery power remained constant at 8.0 MW, which allowed us to examine the additional improvements in both financial return and certainty by purchasing additional capacity, against our 2.0C reference case. The results are shown in table 2.
Year |
0.25C |
0.5C |
1.0C |
2.0C |
| 2014 | $ 84.99 | $ 79.40 | $ 74.43 | $ 71.43 |
| 2015 | $ 87.42 | $ 81.06 | $ 75.16 | $ 72.30 |
| 2016 | $ 103.86 | $ 95.16 | $ 88.63 | $ 85.32 |
| 2017 | $ 156.27 | $ 146.25 | $ 136.78 | $ 131.71 |
| 2018 | $ 88.15 | $ 83.45 | $ 79.94 | $ 78.07 |
| Average (All years) | $ 104.14 | $ 97.06 | $ 90.99 | $ 87.77 |
| Breakeven Marginal Cost $/kWh battery | $ 254.04 | $ 336.66 | $ 349.57 | – |
Table 2 –Financial results by C rating
What these results show is that additional capacity in terms of energy adds certainty and improves revenue but if we measure the additional revenue against the capacity, we can measure a break-even marginal cost. This breakeven cost indicates the capital cost a battery would need to beat to make the additional capacity purchase worthwhile.
Concluding Remarks
We have taken a portfolio approach using a renewable generator, a battery and contracts rather than attempting to gamble future returns solely on a battery. This is essentially what most professional generation companies have been doing for decades. In this limited 5-year analysis, we have shown that this combination is effective in producing a revenue stream that is above expected PPA’s or simply taking spot revenues.
Delving a little deeper into the economics, if 2.0C battery is assumed to be $1000/kWh, the implied cost to structure is around $10/MWh, possibly a cost that could be borne by the solar farm owner.
Fundamentally, selling a contract is selling insurance, which earns a premium in the long term, with battery a risk mitigation to manage cash flow and also providing dispatchability in the wholesale market. We would expect that greater interest in this business structure will develop as battery costs fall.
Note: We also prepared a detailed report of the Hornsdale Power Reserve’s Tesla battery at Jamestown in South Australia. Further information is available at: (https://www.apogeeenergy.com.au/uncategorized/nem-battery-performance-south-australia-report/)
——————————————-
About our Guest Author
 |
Warwick Forster is an experienced energy professional with 20 years of experience covering energy trading, risk management, market operations, retailing, pricing, renewable project development and energy storage.
He is now an independent energy markets consultant operating through the business, Apogee Energy. You find Warwick on on LinkedIn, and Twitter.
|
great note
Thanks Warwick – given the (relatively small) sizing of the battery, how is the shape risk of the flat swap managed by the solar farm? i.e. in periods where generation is insufficient to deliver the floating leg of the swap, how does the solar farm manage the risk that the cost to procure that power at spot is higher than the fixed swap price (particularly if the price is spiking above $300/MWh, and the battery is depleted)?
Thanks David,
Hi Nick, your question relates to the valuing of risk as there are often periods where there is insufficient energy in the battery to deliver to match the contract level. What needs to be appreciated is that the battery is providing the best financial solution not providing an engineering solution for an islanded system. So yes, you might not always have enough energy in the battery to “defend” your contracted position, but in measuring the balance between the capital cost of the battery vs a desire to match every possible half-hourly price spike, it seems the best compromise is to make the battery as small as possible. Also, the battery might charge multiple times or make arbitrage over night or on weekends, making additional revenue for the project.
This is similar to generators in the wholesale market (including baseload coal) that sell contracts against their output and face the risk than an outage will mean that they could lose money. They take a calculated risk that in the long term, contracting is best and accept the non-zero risk of an unplanned outage.
regards
Warwick
Thanks Warwick, it is an interesting concept.
I am referring to the ability of the solar farm to defend its contracted position, noting it is not dispatchable. Because the flat peak swaps traded on the market (used in your example) do not follow the shape of standard solar production, there is a mismatch in the shoulder periods (irrespective of outages). Is your solution to effectively self insure, I.e to reserve the surplus revenue above the contracted volume to settle the swap in the shoulder period?
Hi Nick,
It’s true that the solar farm is not dispatchable but the battery is. You are correct that the there will be times when we expect no solar production (i.e. after sunset and until 10pm) or limited production (early in the morning/late afternoon) yet there is a contract position to defend. You could say we “self-insure” in that we accept the risk that there may be a time when the battery is out of charge, solar is below the contracted level and the spot price is above the contract price but this is a calculated risk, mainly weighed up against the expectation based upon observed history that we would expect to earn close to the contract rate of $87/MWh (before battery cost) vs a PPA price of $40-50/MWh if one is available.
The alternative is to negotiate a swap contract that better matches the expected solar production but this would be difficult as the profile does not usually match a customer load, so we’d expect a discount to the standard contract, which is exactly the case with a PPA which is a perfect match to the profile.
In the end, if you’re willing to prepare a more complex integrated business model, you may be able to achieve a better return for your investment with less uncertainty. Alternatively, you can take spot revenue with absolutely no certainty or you can negotiate a fixed low price PPA with no price uncertainty.
It’s also worth noting that usually wind or solar projects “self-insure” even under a PPA as they do predictions of the expected annual energy yield and do a probabilistic estimate of the potential outcomes. Financiers may also require a P90 or P95 (i.e. an annual number that is satisfied 90 or 95% of years). This means that whilst they have no price risk, they do have volume risk, which can actually be insured against through bespoke weather derivatives or other insurance products.