2018 will likely go down as the year that fossil fuels in Australian electricity generation began an inexorable decline, with renewable energy making significant in-roads. These will continue into 2019 and 2020, and almost certainly beyond that.
Renewable energy broke through the 20% market share threshold for the first time since the 1970’s, achieving a share of 21.3% across the combination of Australia’s main east and west-coast grids. This was significantly up on 2017’s share of 17%.
Much of this growth was concentrated in Australia’s east coast grid, with limited growth in renewable generation in WA or the Northern Territory (confined to rooftop solar), in spite of their rich renewable resources.
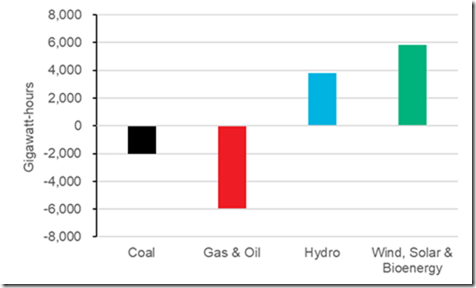
Within the east coast National Electricity Market both coal and gas generation fell in absolute terms in 2018 relative to the prior year. Gas suffered a particularly big fall, dropping by 26% on the prior year. Wind and solar by contrast experienced substantial growth. Wind generation was up in the NEM by 26%, while solar was up by 35%. Hydro generation was also up substantially by 29%, however this represents more of a cyclical, short-term phenomenon.
Figure 1 – Change in levels of power generation by fuel in 2018 compared to 2017 for NEM
Source: Green Energy Markets Renewable Energy Index analysis of AEMO data via NEMreview and LGC and STC registry data
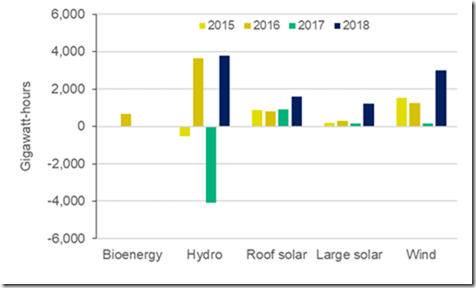
Extending our gaze back several years helps to illustrate the breakthrough renewable energy achieved in 2018. Figure 2 shows the change in generation in one year relative to its prior year. For wind there was a remarkable turnaround in 2018 after almost no growth in 2017 (which was a legacy of the Abbott-induced investment drought over 2014 and 2015). Rooftop solar has been steadily growing generation year on year but 2018 saw a big leap up, 86% greater than the average additions of 2015-2017. Yet it was large scale solar farms that really jumped out of the blocks in 2018 with generation leaping up by almost 300% on the prior year. It passed the 1,000GWh mark over the year although it remains small at present, but with a far bigger impact to be seen this year and next as thousands of megawatts under construction come online. The chart also shows how hydro tends to see-saw quite dramatically and 2018 happened to be an up year. However, given just how much wind and solar capacity will come online over 2019, hydro could have a down year and overall renewables will still grow its market share.
Figure 2 Change in electricity generation year on year for renewable fuels in NEM
Note this illustrates the change in generations levels for each year relative to levels in the prior year so the light yellow bar marked ‘2015’ shows the increase or decrease in generation levels in 2015 compared to what they were in 2014 for the respective fuel.
Source: Green Energy Markets Renewable Energy Index analysis of AEMO data via NEMreview and LGC and STC registry data
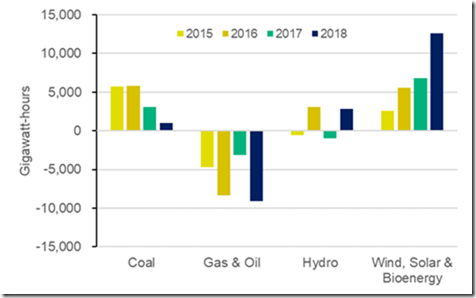
While 2018 was promising for renewable energy, the overall task of decarbonising the grid remains substantial. Figure 3 shows the cumulative change in generation levels by fuel type relative to 2014. While wind, solar and bioenergy generation has grown substantially since 2014, coal generation levels still remain above 2014 levels (albeit just slightly now). This is quite remarkable when you consider that Northern, Anglesea and Hazelwood Coal Power Stations closed over this period. In 2015 coal generators realised a large jump in generation levels driven more by the start up of Gladstone’s LNG plants than the abolition of the carbon price. These new LNG plants delivered a double windfall to coal of much more expensive gas and extra electricity demand (the LNG industry is a major consumer of electricity). Renewables growth has only just last year managed to whittle away much of coal’s gains made in 2015. Meanwhile gas & oil, after recovering generation levels somewhat in 2017 thanks to Hazelwood’s closure, were pushed down to their lowest levels since the abolition of the carbon price.
Figure 3 – Cumulative change in generation levels by fuel relative to 2014 levels
Source: Green Energy Markets analysis of AEMO data via NEMreview and LGC and STC registry data
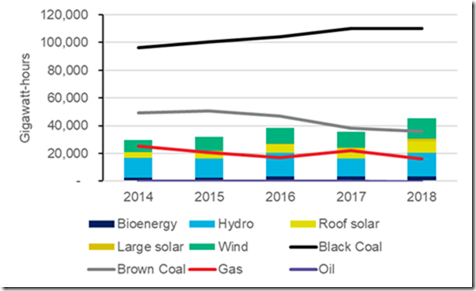
Figure 4 puts this into overall perspective looking at absolute levels of generation rather than levels of change. It shows that while brown coal and gas have declined, black coal has been chalking up significant growth in generation levels since 2014 which only flatlined in 2018.
Figure 4 Renewable energy power generation relative to other fossil fuels since 2014 in the NEM
Source: Green Energy Markets Renewable Energy Index analysis of AEMO data via NEMreview and LGC and STC registry data
Looking forward though, black coal will see some noticeable declines in 2019. While large-scale solar farms were pretty small beer in the NEM in 2018 generating 1,850GWh, next year we expect their generation to lift to around 8,000GWh. While wind recorded a big lift in generation levels in 2018 relative to prior years, it will add double that amount of generation in 2019. Wind farms already under construction or contracted will add the same amount extra in 2020. Then we can add onto this a full year’s impact from the 1600MW of small-scale rooftop solar installed over 2018 and plenty more progressively added to the grid over 2019.
This means not just gas and brown coal, but also black coal power plants will see their generation suffer significant falls in 2019, with the only bright side for fossil fuels being less hydro generation from Snowy, whose storages have run low over 2018.
————-
About our Guest Author
|
|
Tristan Edis is the Director – Analysis & Advisory at Green Energy Markets. Green Energy Markets assists clients to make informed investment, trading and policy decisions in the areas of clean energy and carbon abatement.
You can follow Tristan on Twitter @TristanEdis. |


If we are going to crunch the numbers…
Clean Energy Council – $10b wind and solar investment in 2017
Environment.gov.au – 2.8% emissions reduction in the electricity sector across 2017
That’s $1b per 0.28% emissions reduction
Wind and solar generation increased by around 3000 GWh in 2018
That’s $1b for every 300 GWh increase of wind and solar
Australia’s total electricity consumption is around 200,000 GWh per year
The ALP 50% renewables target is therefore 100,000 GWh
Current wind and solar total generation is around 16,000 GWh per year
100,000 – 16,000 = 84,000 GWh remaining to achieve 50%
84,000 GWh / 300 GWh/$1b = $278b
If they do that all with wind and solar over ten years, this will cost $28b/yr
Not including any costs for transmission lines or substations or SVC or reactors or condensors or batteries…
And not touching emissions from agriculture or transport or industry…
Ben those numbers are quite large. But if the will is there sometimes a way is found. Germany is also still going forward with a lot of will.
next 10 years its going to get interesting.
But I will guess this, if the will falls short, it will only be, becuase of this or that, and it can still all work, it just need this and that!!!!!!.
John, investment in generation technology and assets has to be performed at the lowest cost that meets the system requirements. Government subsidies have effectively removed the function of the market.
Despite the massive subsidies and investment in renewables:
Electricity cost to consumers has increased
Electricity reliability has reduced
Electricity sector emissions have reduced
I put it to you John, what in your opinion is the priority for a country’s electricity system? I suggest that “reducing emissions” is not the core business of an electricity system.
Grid
Hi Ben, I think number one is, that we need power, I think number two we need as close to the lowest cost we can get in the world. We with coal had number one sorted, but failed with number 2, even though we could have had the cheapest in the world.
The path we are going down now, I just hope gets number 1 covered, because useing history as my guide for number 2. We are not going to have cheap power.
Hi John, I agree completely. Priority 1 = delivery of power when it’s needed. Priority 2 = lowest possible cost.
These priorities are closely linked through cost-benefit, with the largest deciding factor being the cost of not delivering power when needed. If the cost of blackout is less than cost of power, then power cost is too high. The reverse is where we normally sit – cost of power is less than cost of blackout, hence the NEM 99.998% reliability target, normally most at risk by network issues (much more wires than there are generators).
The “renewables at any cost” advocates and lobbyists want greater reliance on interconnectors and try to dismiss reliability concerns with “distributed generation”, except then we are at the mercy of a greater percentage of power in transmission lines PLUS the vagaries of the weather.
This is not a rational objective.
Hi Ben,
Yes plus just how much needs to be maintained its simply mind blowing.
I have been trying to work out Rooftop Solar, and am wondering if you might know about how far it can travel within the grid.
So by that i mean, if say all of one area at midday is awash with solar, and the solar has to travel backwards through a transformer to the go where ever it has to go, to then go through a transformer again, and to another person house.
What are the losses going backwards through a transformer, and also what distance can it go, once it has gone that way.
So lets say the transformer it goes through is 400 meters away, to start with, what would that loss be?, then being stepped up, what is that loss, then say another 400 meters to another area, in HV, then back down through another transformer, what is that loss?, then to someones house, say another 300Meters.
And for fun lets say that houses demand is 80% to charge a Tesla Powerwall battery?
What amount of solar power is going to make it into the battery?
Then what amount will make it out of the battery.
So all up the solar power only has to travel 1100meters?.
(I am going to guess the % is going to be lower than going just one way from a power station that is designed to deliver a long distance to a lot of people)
John: I suggest you read this article from Stanford University that talks directly to yours and the original posters statements. https://quillette.com/2019/02/27/why-renewables-cant-save-the-planet/
or a video if you prefer https://www.youtube.com/watch?v=N-yALPEpV4w
I am amazed that wind and solar generation which was invented in the 1890’s, along with the first coal-fired generator is thought to be the solution. I want to go forwards not backwards to intermittent energy. Nuclear energy and hopefully Thorium is the way to go.
I also think electricity should be much cheaper if we are going to power our planet.